
-
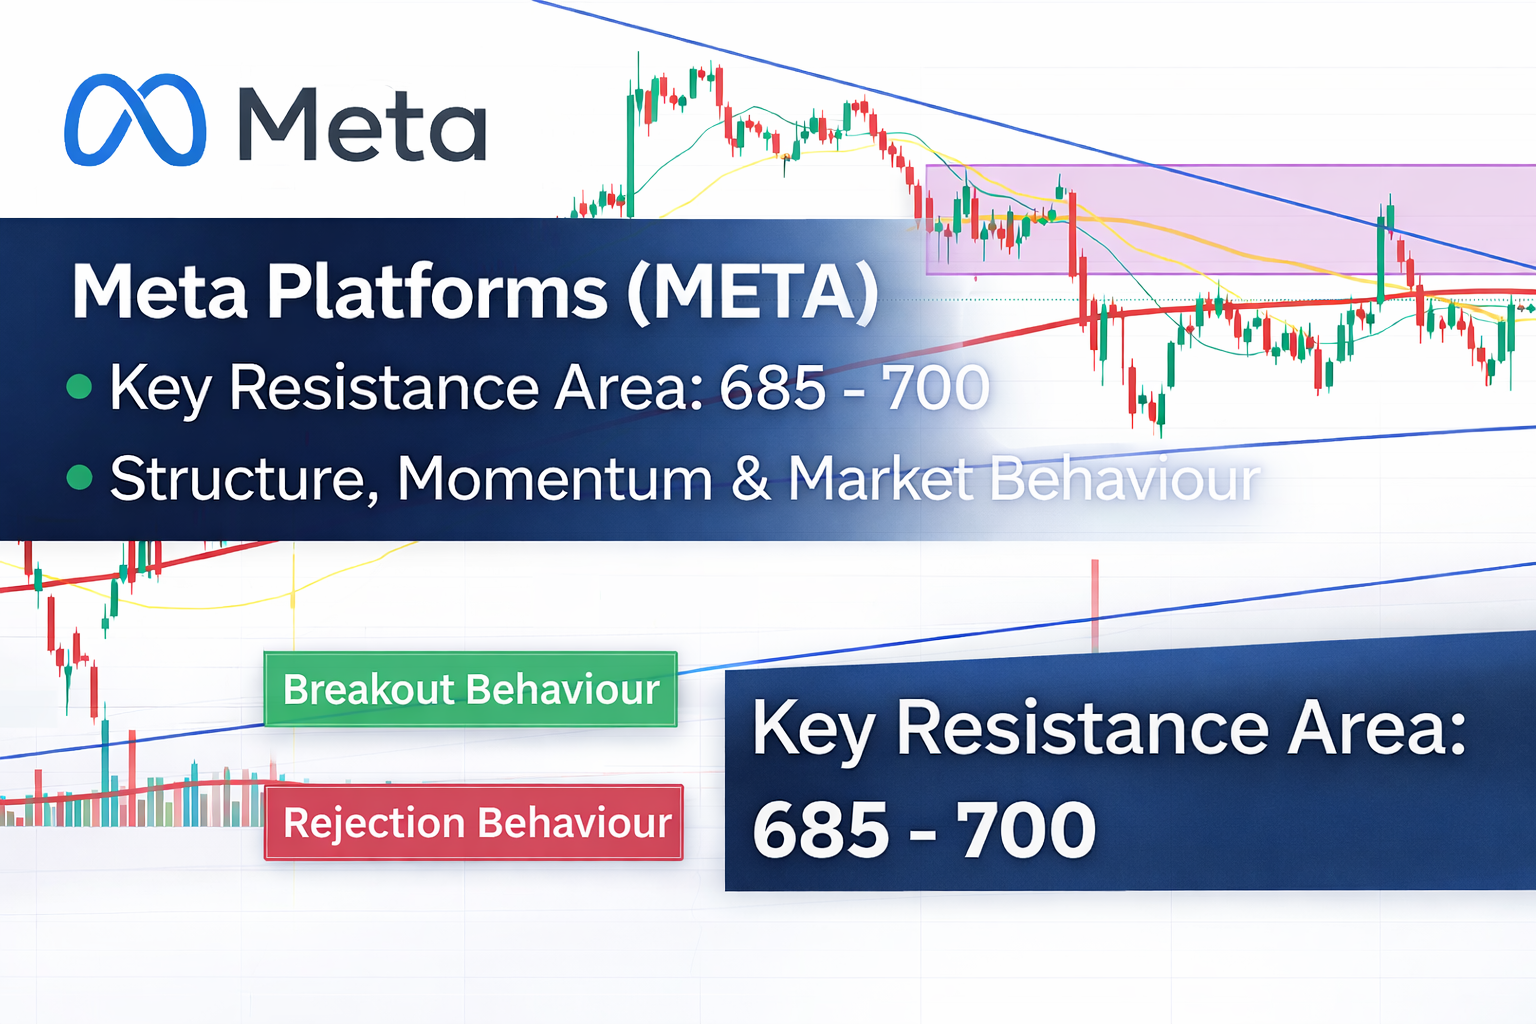
Overview In this analysis, we break down how we are currently reading Meta Platforms (META) from a technical perspective. The chart presents a developing structure where price is attempting to recover, but is still trading within a broader resistance framework. Our focus is not on predicting, but on understanding structure, confirmation, and risk control. 1.…
-
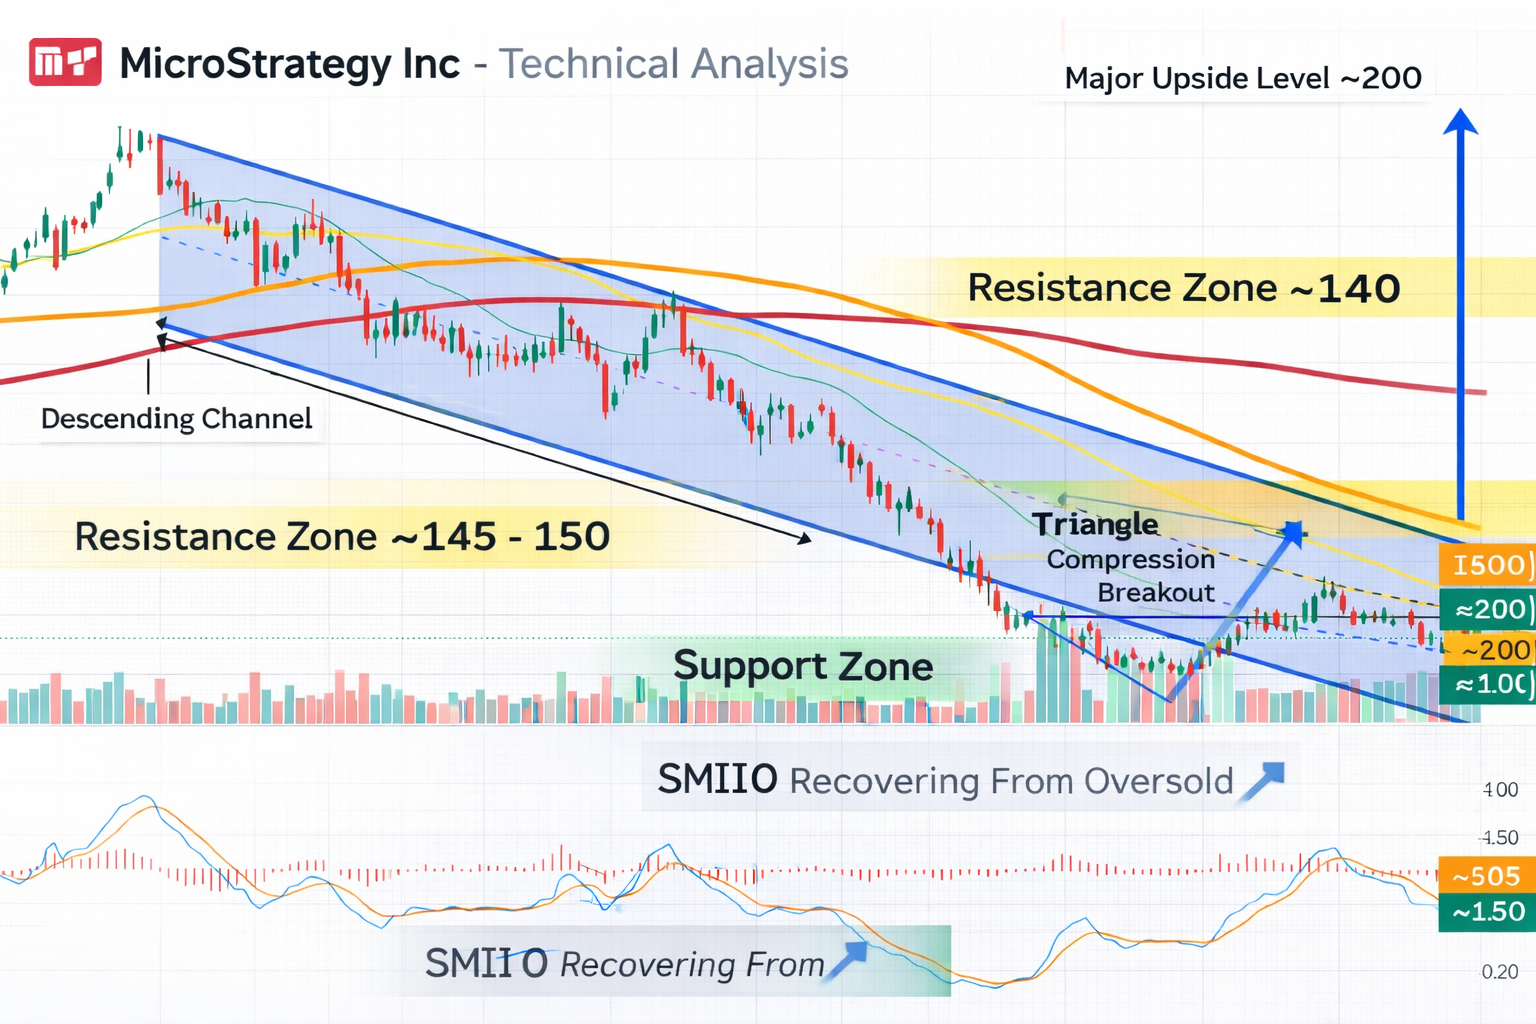
Market Structure Overview From a broader perspective, MSTR has transitioned from a strong bullish trend into a clear bearish structure over recent months. This is a classic example of how trend transitions develop gradually, rather than reversing instantly. Bearish Channel → Loss of Momentum Within the descending channel: However, what we are seeing now is…
-
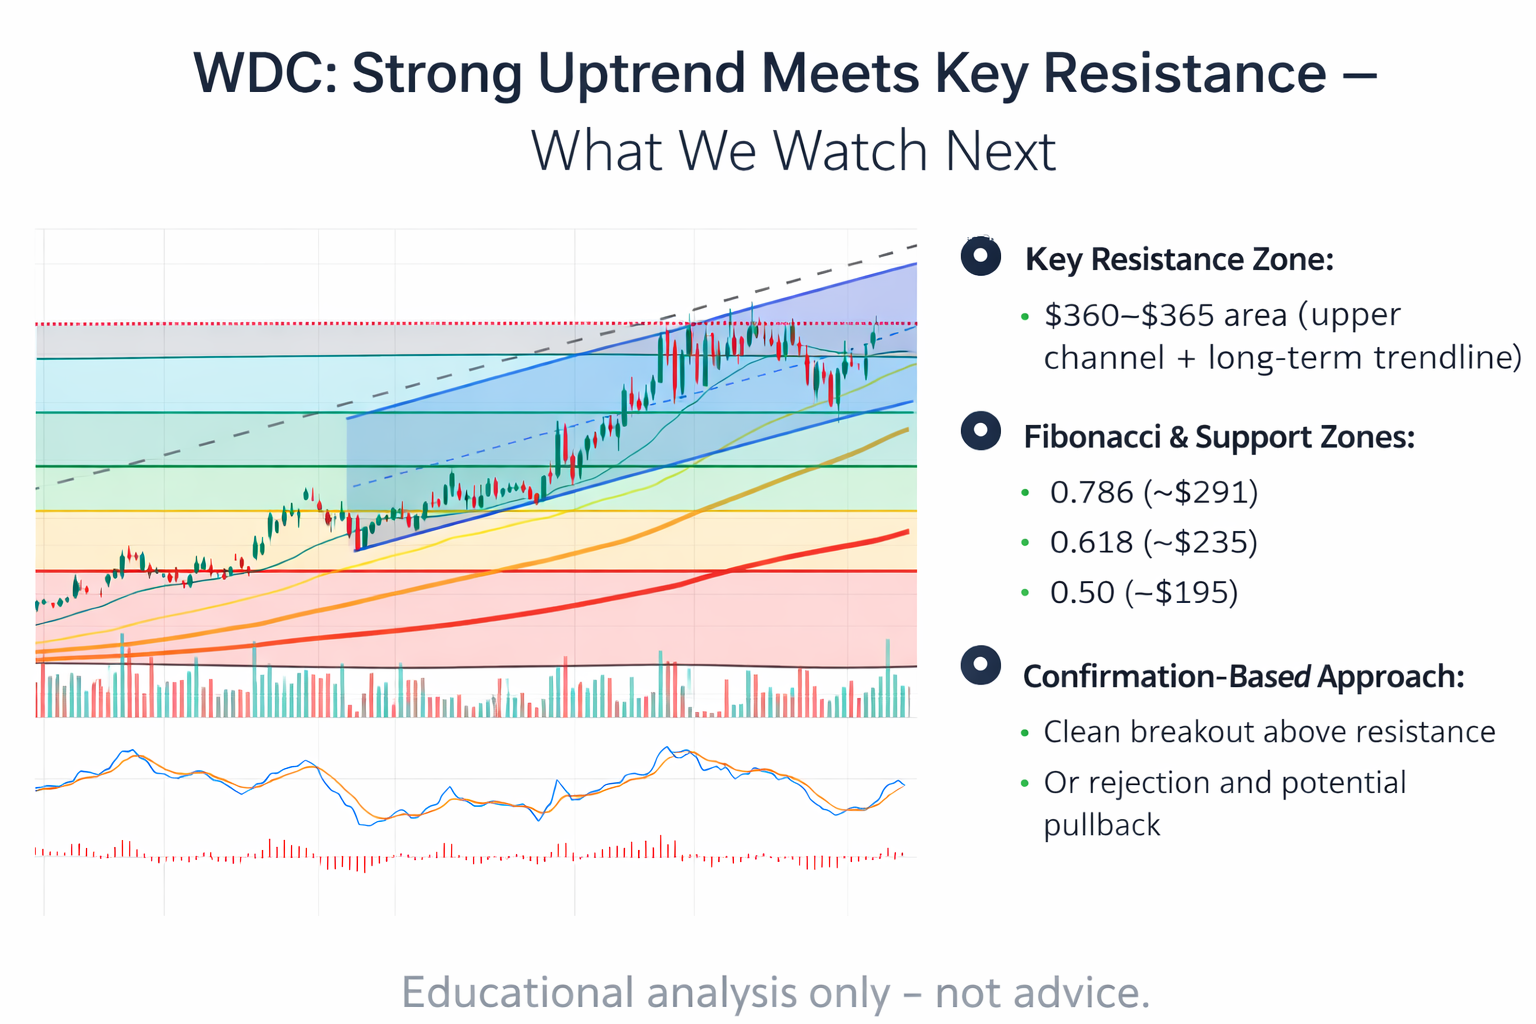
Western Digital (WDC) has delivered a strong bullish move over recent months, supported by both structure and momentum. However, as price approaches a key resistance zone, we are now shifting our focus from trend continuation to confirmation and risk management. 1. Trend Structure: Strong but Extended The chart shows a well-defined bullish channel, with price…
-
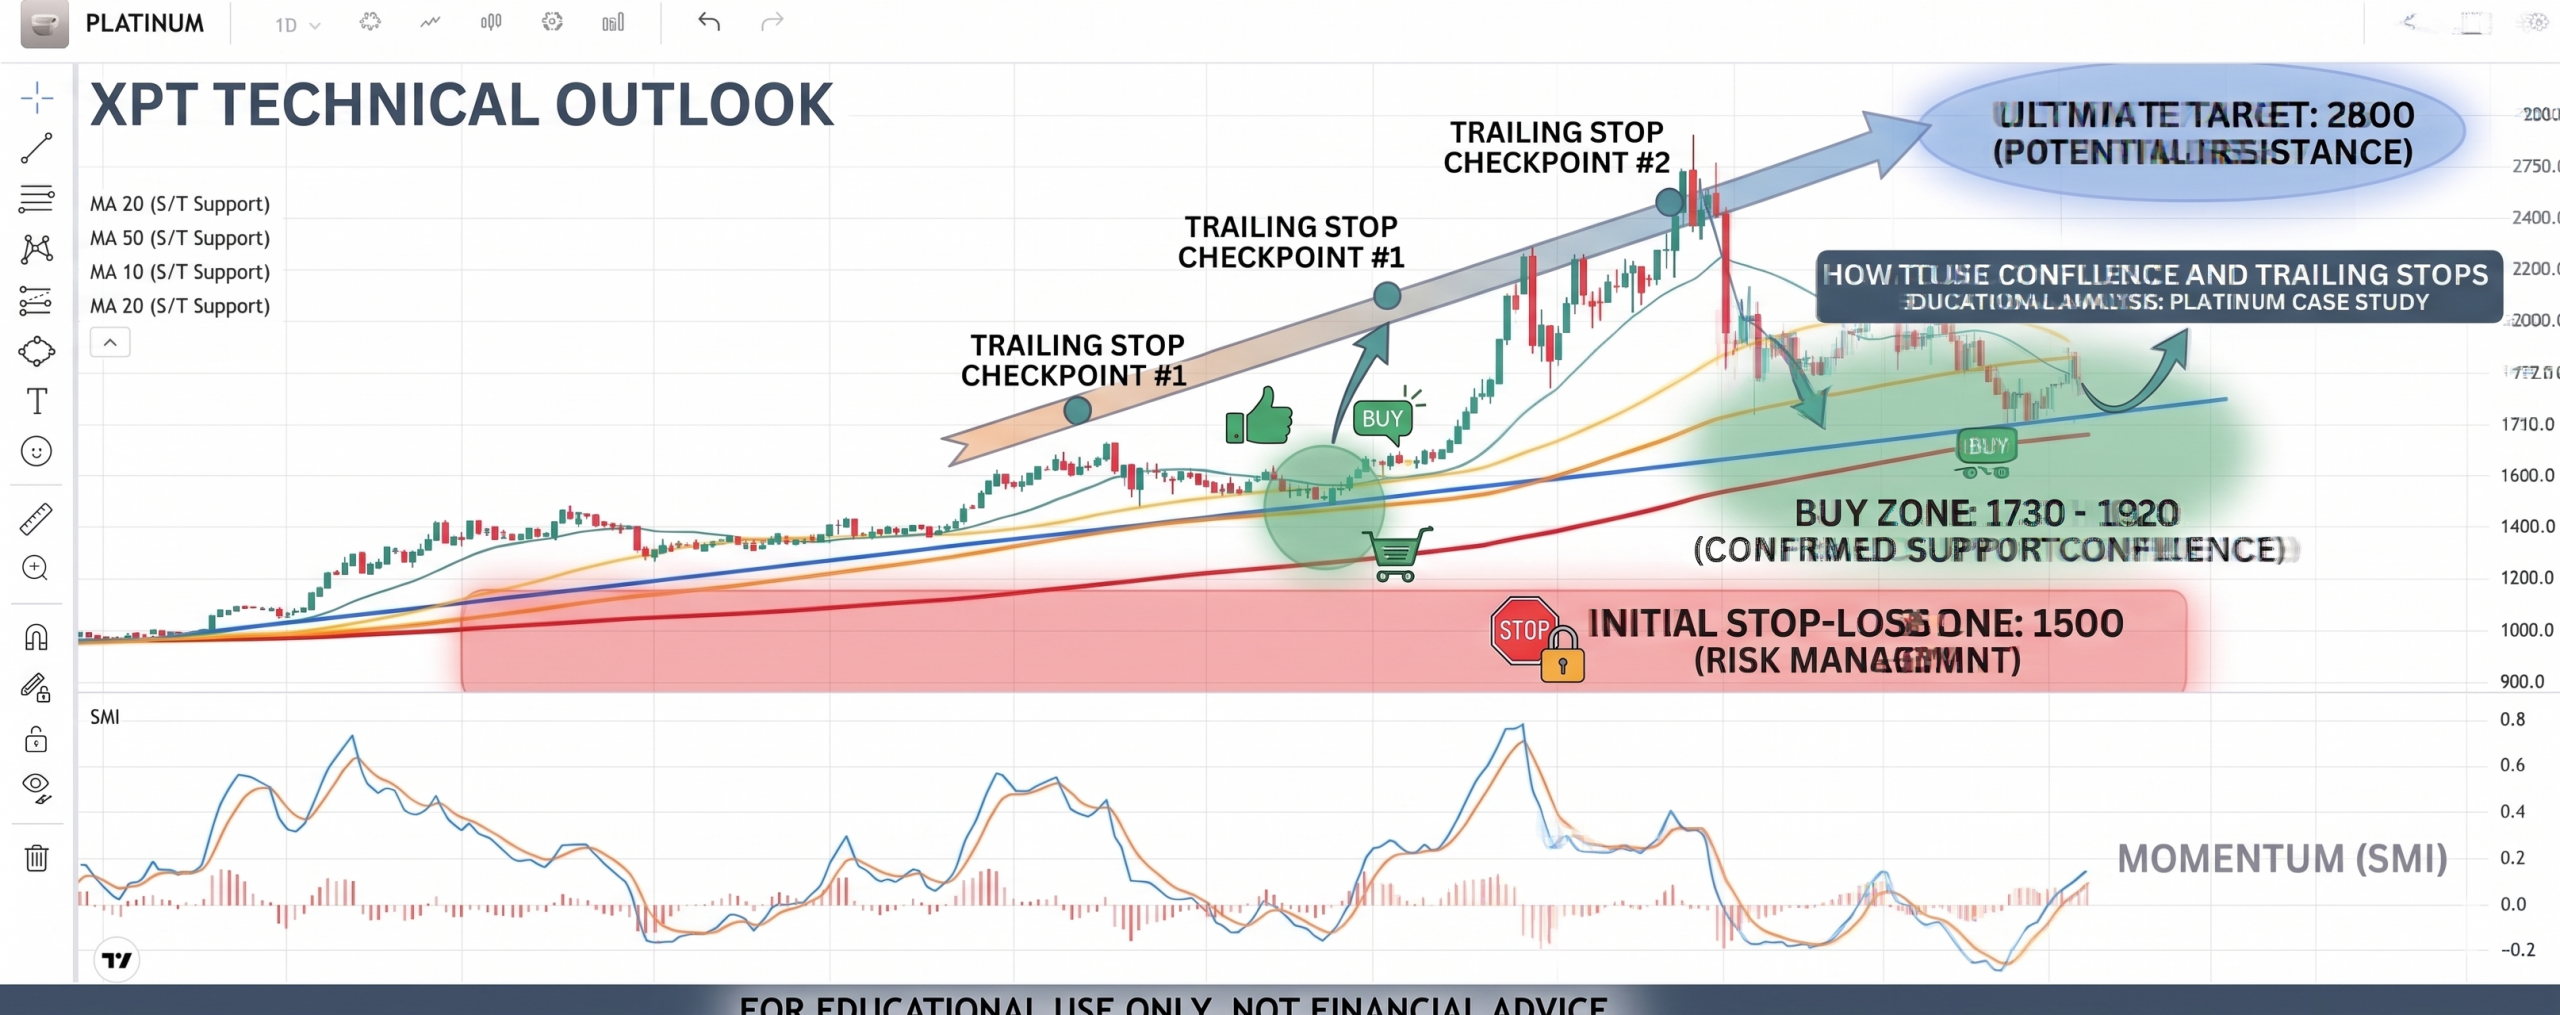
The current Platinum chart presents a textbook example of technical confluence, where multiple independent indicators align to validate a specific price zone. As of April 15, 2026, Platinum is trading near $2098.1, testing critical moving average resistance after a significant recovery from March lows. Trade Setup & Execution Table Parameter Level/Strategy Technical Rationale Primary Entry…
-
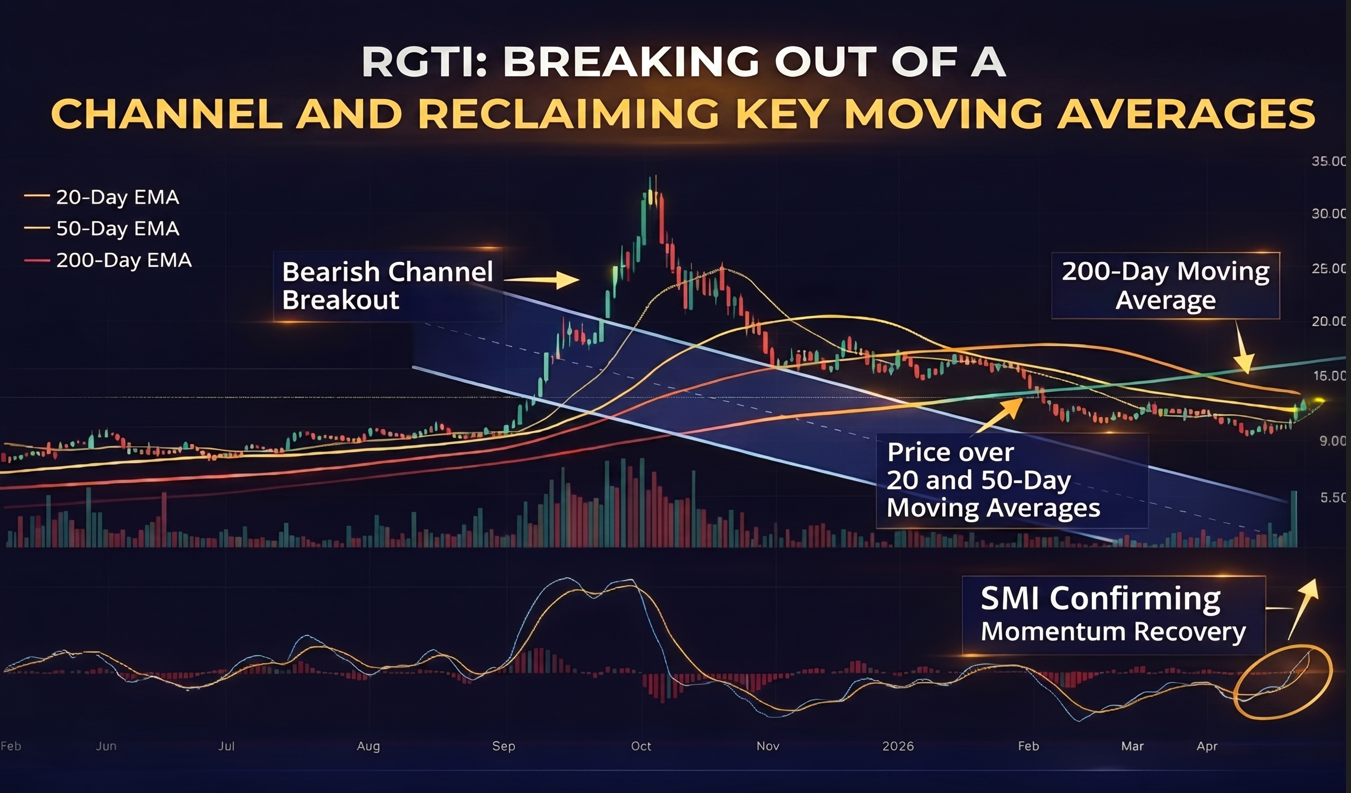
We are currently observing a potential shift in structure on Rigetti Computing (RGTI), as price begins to recover from a prolonged bearish phase. 1) Bearish Channel Break – First Sign of Change The most important development is that price has broken out of the bearish channel that has been controlling the downtrend for several months.This…
-
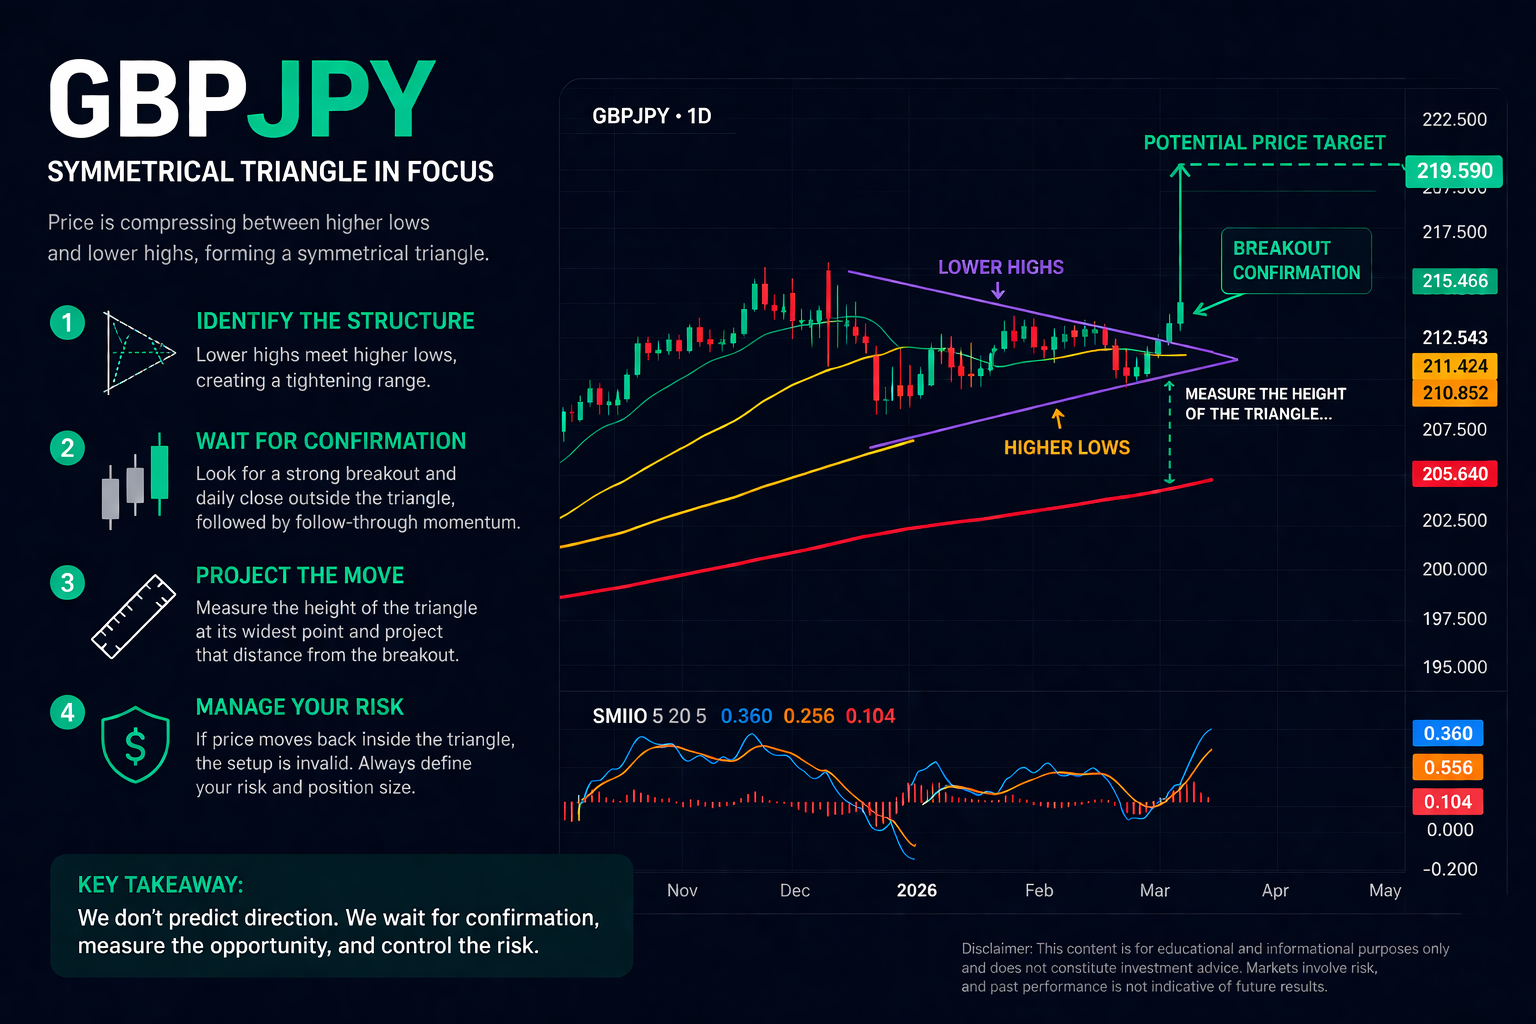
We are currently observing a symmetrical triangle formation on GBPJPY, a structure that often signals a continuation move, but only after proper confirmation. 1) Identify the Structure A symmetrical triangle forms when: This creates a tightening range, showing market indecision before expansion. In this case, GBPJPY respected both trendlines, compressing price into the apex. 2)…
-
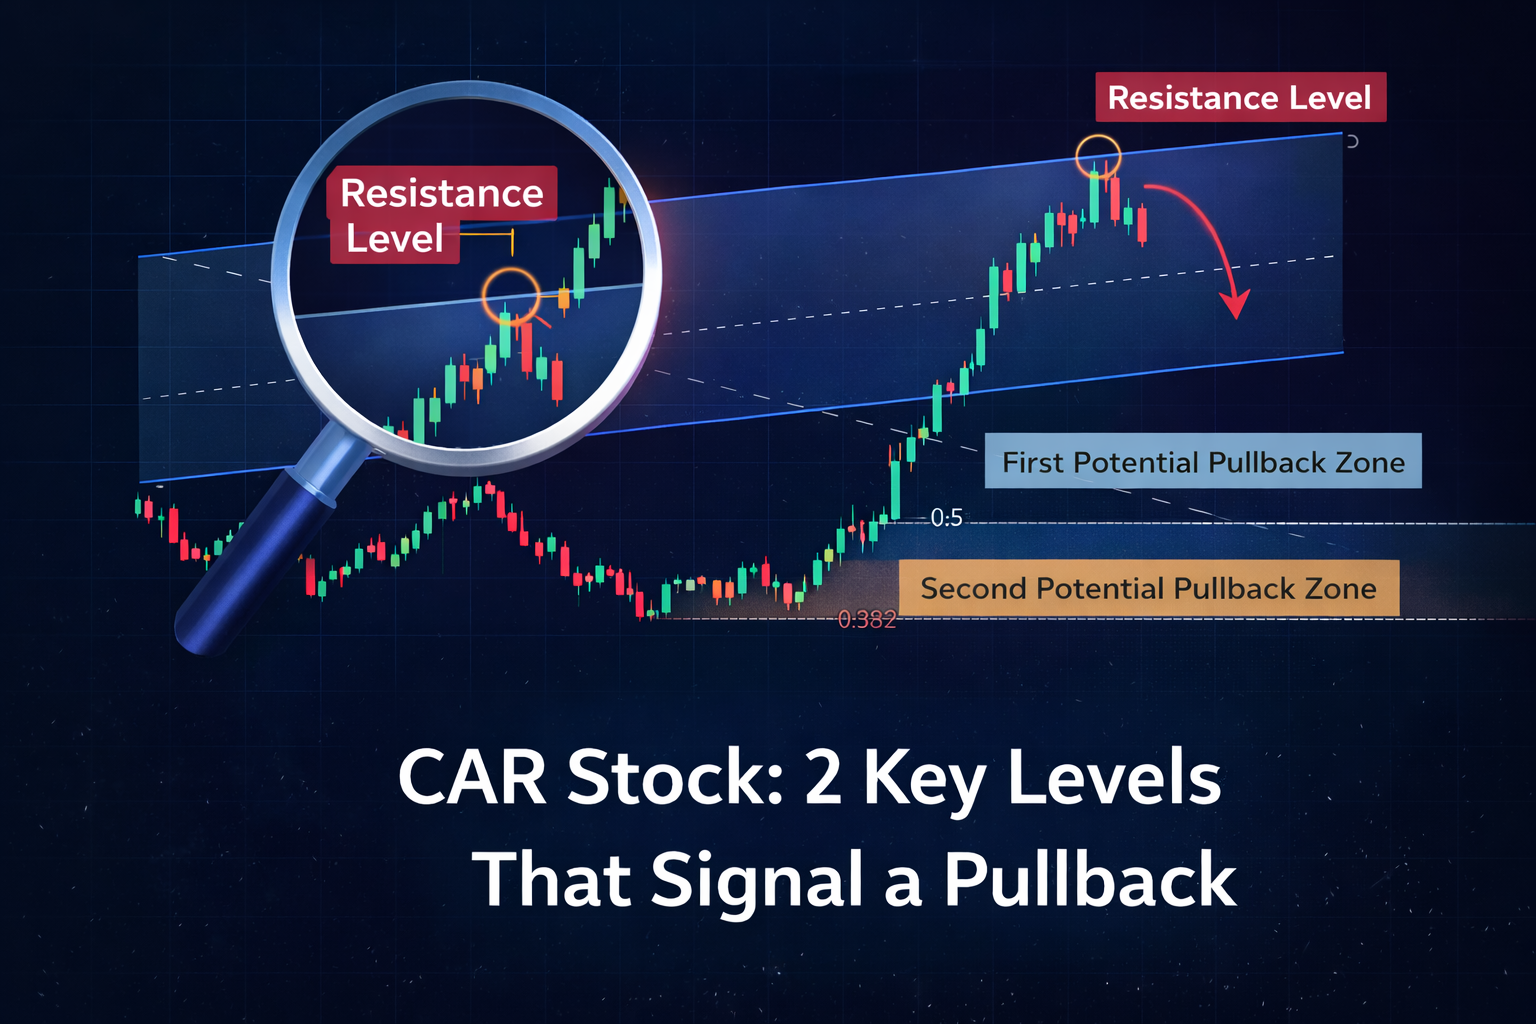
How We Build the Parallel Channel (Step-by-Step) In this analysis, we take a slightly different, and more structured, approach. 👉 This gives us a projected upper boundary, which helps identify where price could react in the future. This is key: We are not reacting to price — we are projecting structure forward. Why the 2026…
-
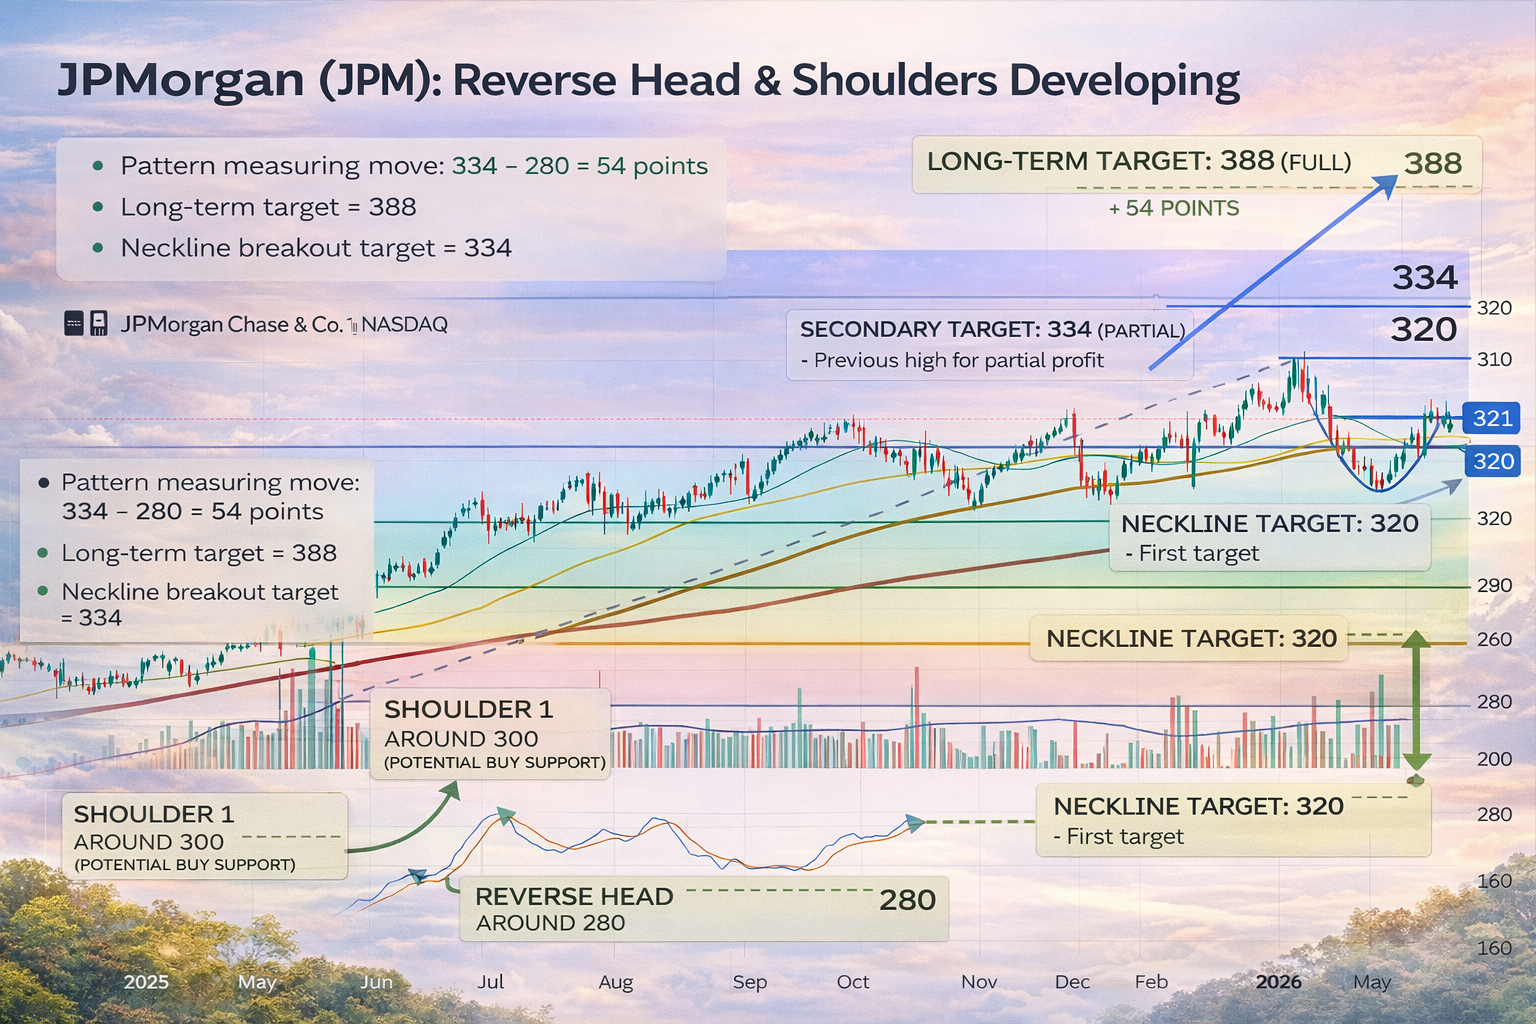
1) Current Structure – Building the Reversal At the moment, price is pushing towards the 320 region, which aligns with a key resistance area. From a structural perspective, this move appears to be forming the head of a potential inverse (reverse) head & shoulders pattern, suggesting that the market may be transitioning from consolidation into…
-

Understanding the Bigger Picture This type of chart represents a well-defined bullish channel, where price consistently respects both the upper resistance and lower support boundaries. One of the most important observations here is: Price has repeatedly respected the lower boundary of the channel without breaking it. However, this does not guarantee continuation. Markets are dynamic,…
-

We are currently analysing EURUSD through a structured price action and intermarket lens, focusing on confirmation rather than anticipation. 1. Momentum & Structure AlignmentFrom a momentum perspective, the SMIIO indicator is showing signs of recovery, indicating that downside pressure is gradually fading. At the same time, price action has started to shift: As we know,…