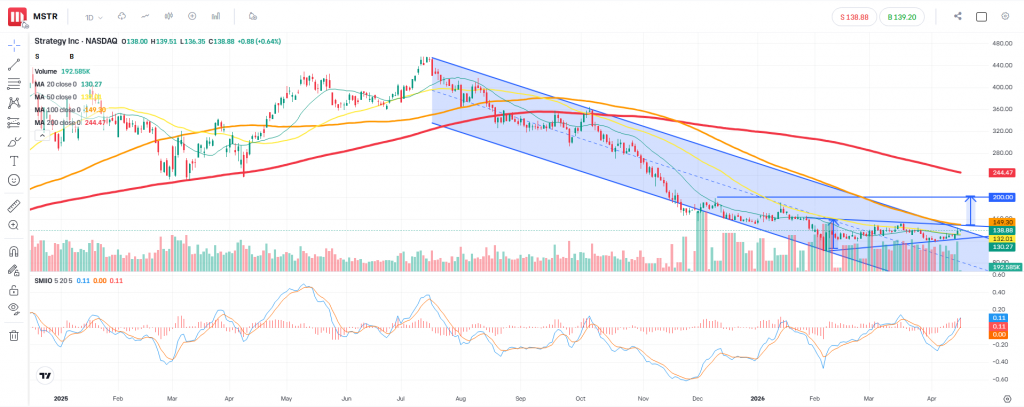
Market Structure Overview
From a broader perspective, MSTR has transitioned from a strong bullish trend into a clear bearish structure over recent months.
- The price initially moved within a well-defined bullish phase, making higher highs and higher lows.
- This structure broke down, leading into a descending channel, confirming a shift in momentum.
- Since then, price has respected the bearish channel, consistently producing lower highs and lower lows.
This is a classic example of how trend transitions develop gradually, rather than reversing instantly.
Bearish Channel → Loss of Momentum
Within the descending channel:
- Price remained below key moving averages (20, 50, and 100 DMA)
- Each rally attempt was rejected near dynamic resistance levels
- The structure showed controlled selling rather than panic, which often indicates institutional distribution
However, what we are seeing now is a loss of downside momentum.
Current Structure: Compression Phase
Recently, MSTR has started forming a tight consolidation / triangle structure near the lower end of the channel.
This is important because:
- The market is no longer making aggressive lower lows
- Price is compressing between support and descending resistance
- Moving averages are starting to flatten, signalling indecision
This type of structure often precedes a volatility expansion.
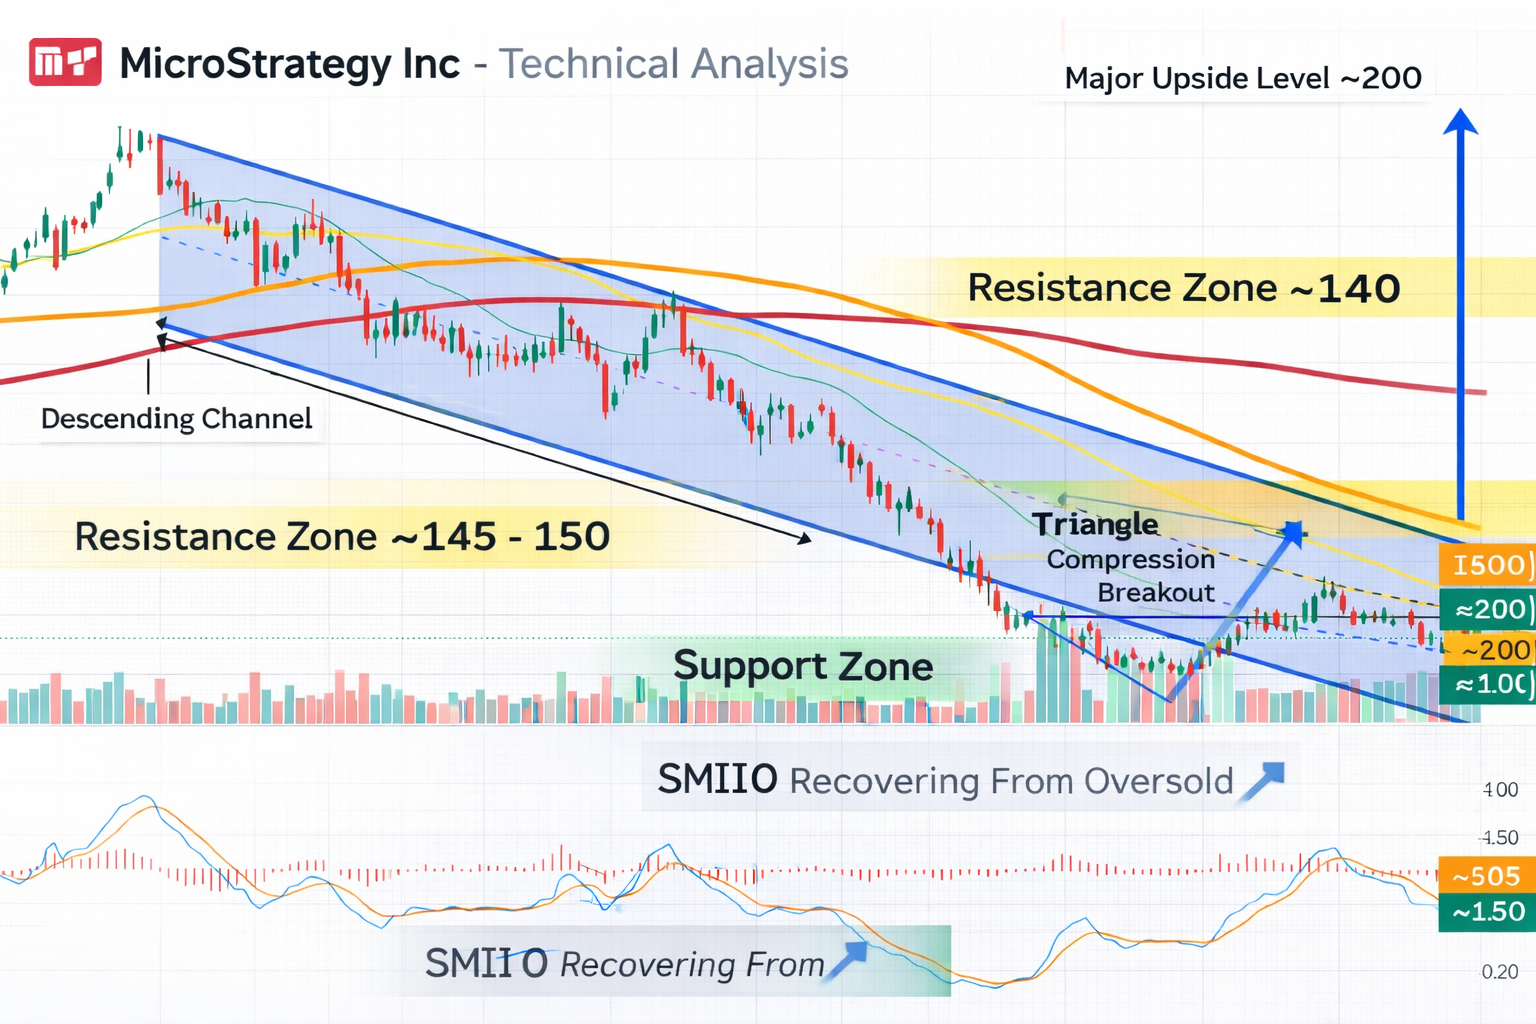
Key Levels We Are Watching
Resistance Zone
- ~145 – 150 area
- Confluence of:
- Descending trendline
- Moving averages (20 & 50 DMA)
- Confluence of:
- A break above this area would be the first sign of structural change
Major Upside Level
- ~200 level
- Previous structure / supply zone
- Acts as a medium-term recovery target if momentum shifts
Support Zone
- ~130 area
- Current base of consolidation
- A breakdown below this level could invalidate the compression and continue the bearish trend
Momentum Insight (SMIIO)
- Momentum is starting to recover from oversold conditions
- We are seeing early signs of bullish divergence / stabilisation
- However, no strong trend confirmation yet
This supports the idea that:
The market is transitioning from trend → consolidation → potential breakout phase
How We Approach This (Educational Perspective)
When analysing this type of setup, we focus on confirmation rather than prediction:
- Identify the dominant trend
→ Currently bearish (from the channel) - Recognise momentum shift
→ Selling pressure is weakening - Wait for structure break
- Break above resistance = potential reversal phase
- Break below support = continuation of bearish trend
- Plan risk before entry
- Define invalidation level clearly
- Adjust position size accordingly
Risk Management Reminder
Even though the structure looks like a potential bottoming phase:
- Not every compression leads to a breakout
- False breakouts are common in this environment
- Position sizing and exit planning remain critical
Conclusion
MSTR is currently moving through a critical transition phase:
- Bearish trend → losing momentum
- Price → compressing into a triangle
- Market → preparing for the next directional move
The key question now is:
Will the market break higher and shift structure, or resume the bearish trend?
As always, we let price confirm the story, rather than anticipating it.
Disclaimer
This analysis is provided for educational and informational purposes only. It does not constitute investment advice, a recommendation, or an offer to buy or sell any financial instrument. Trading involves risk, and past performance is not indicative of future results.
Leave a Reply