We are currently observing a potential shift in structure on Rigetti Computing (RGTI), as price begins to recover from a prolonged bearish phase.
1) Bearish Channel Break – First Sign of Change
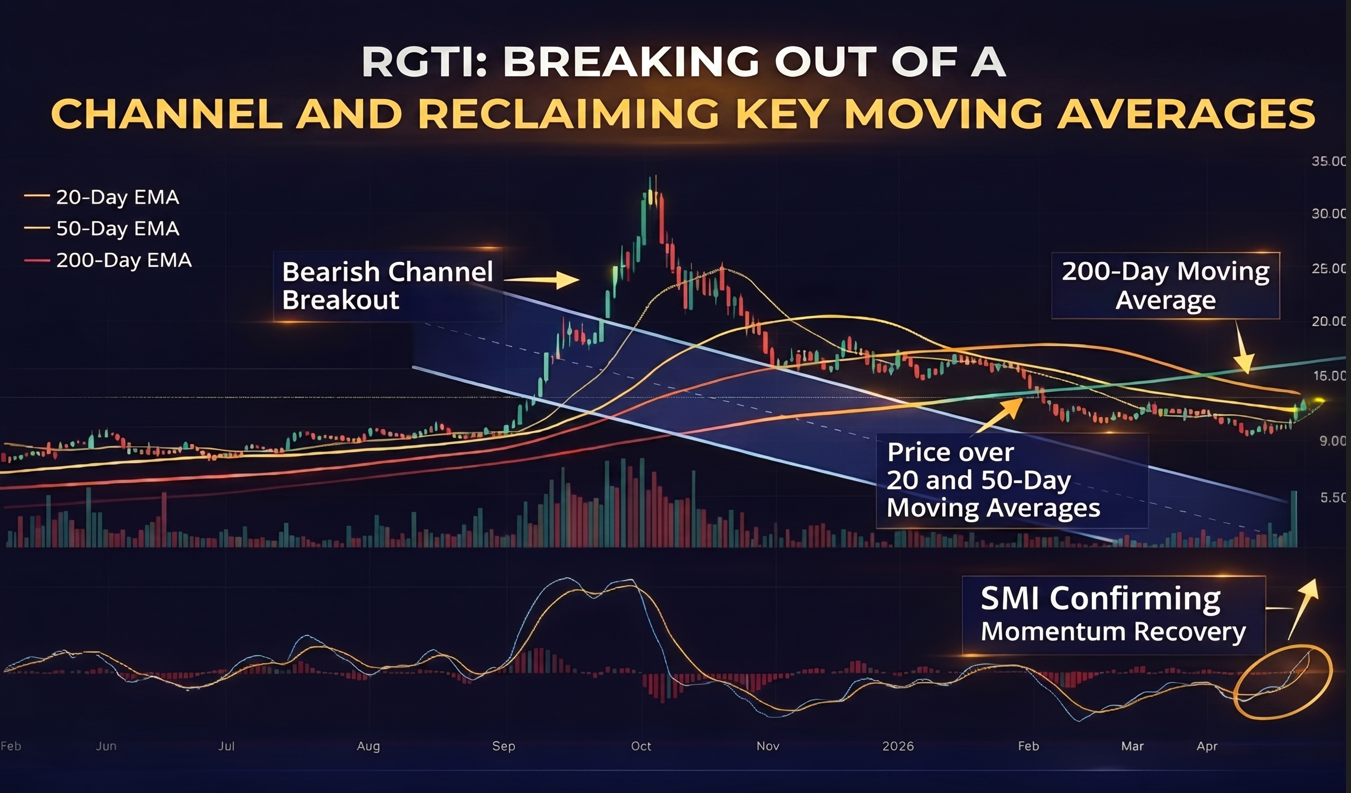
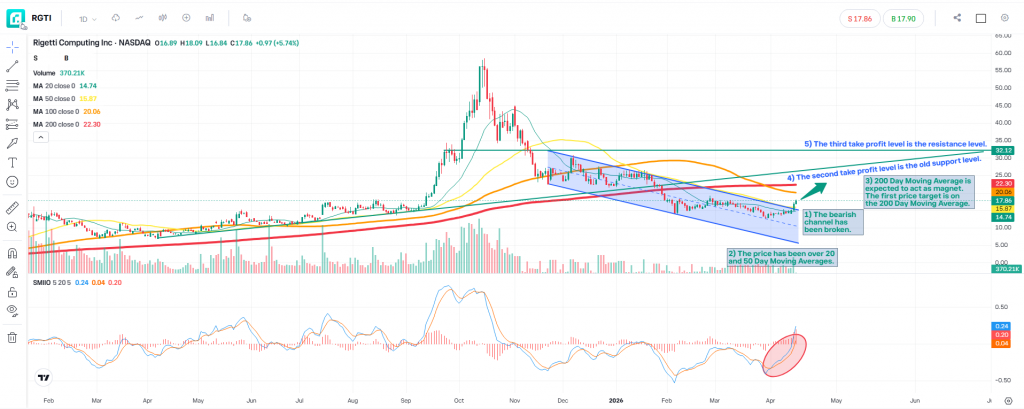
The most important development is that price has broken out of the bearish channel that has been controlling the downtrend for several months.
This suggests that selling pressure may be weakening, but as always, a breakout alone is not enough, we focus on confirmation.
2) Moving Average Reclaim – Momentum Improving
Price has now moved above the 20-day and 50-day moving averages, which is often an early indication of short-term momentum shifting to the upside.
At the same time, the SMI momentum indicator is turning higher, supporting the idea that buyers are gradually stepping back into the market.
3) Key Level in Focus 200-Day Moving Average
The next important area we are monitoring is the 200-day moving average, which often acts as a magnet and dynamic resistance in recovering markets.
- This level represents the first major test of strength
- A reaction here can help us understand whether this move is:
- A short-term bounce, or
- The beginning of a broader trend reversal
4) Structure-Based Targets
From a price action perspective, we are watching key historical levels:
- First area of interest: Around the 200-day moving average
- Second area: Previous support turned resistance
- Third area: Higher resistance zone from prior price structure
These levels are not predictions, but reference points based on past market behaviour.
5) What We Are Watching Next
For continuation, we typically look for:
- Price holding above short-term moving averages
- Higher lows forming after the breakout
- Sustained momentum on indicators like SMI
If these conditions weaken, it may suggest the move lacks strength.
Risk Perspective (Key Lesson)
As always, structure can fail.
If price falls back below the breakout area and loses momentum, the bullish scenario weakens.
This is why:
- Position sizing
- Clear invalidation levels
are essential before considering any trade.
Conclusion
RGTI is showing early signs of recovery with:
- A bearish channel breakout
- Momentum improving
- Price reclaiming key moving averages
However, the 200-day moving average remains a critical test, and we continue to focus on confirmation rather than anticipation.
Disclaimer:
This analysis is for educational and informational purposes only and does not constitute investment advice. Markets involve risk, and past performance is not indicative of future results.
Leave a Reply