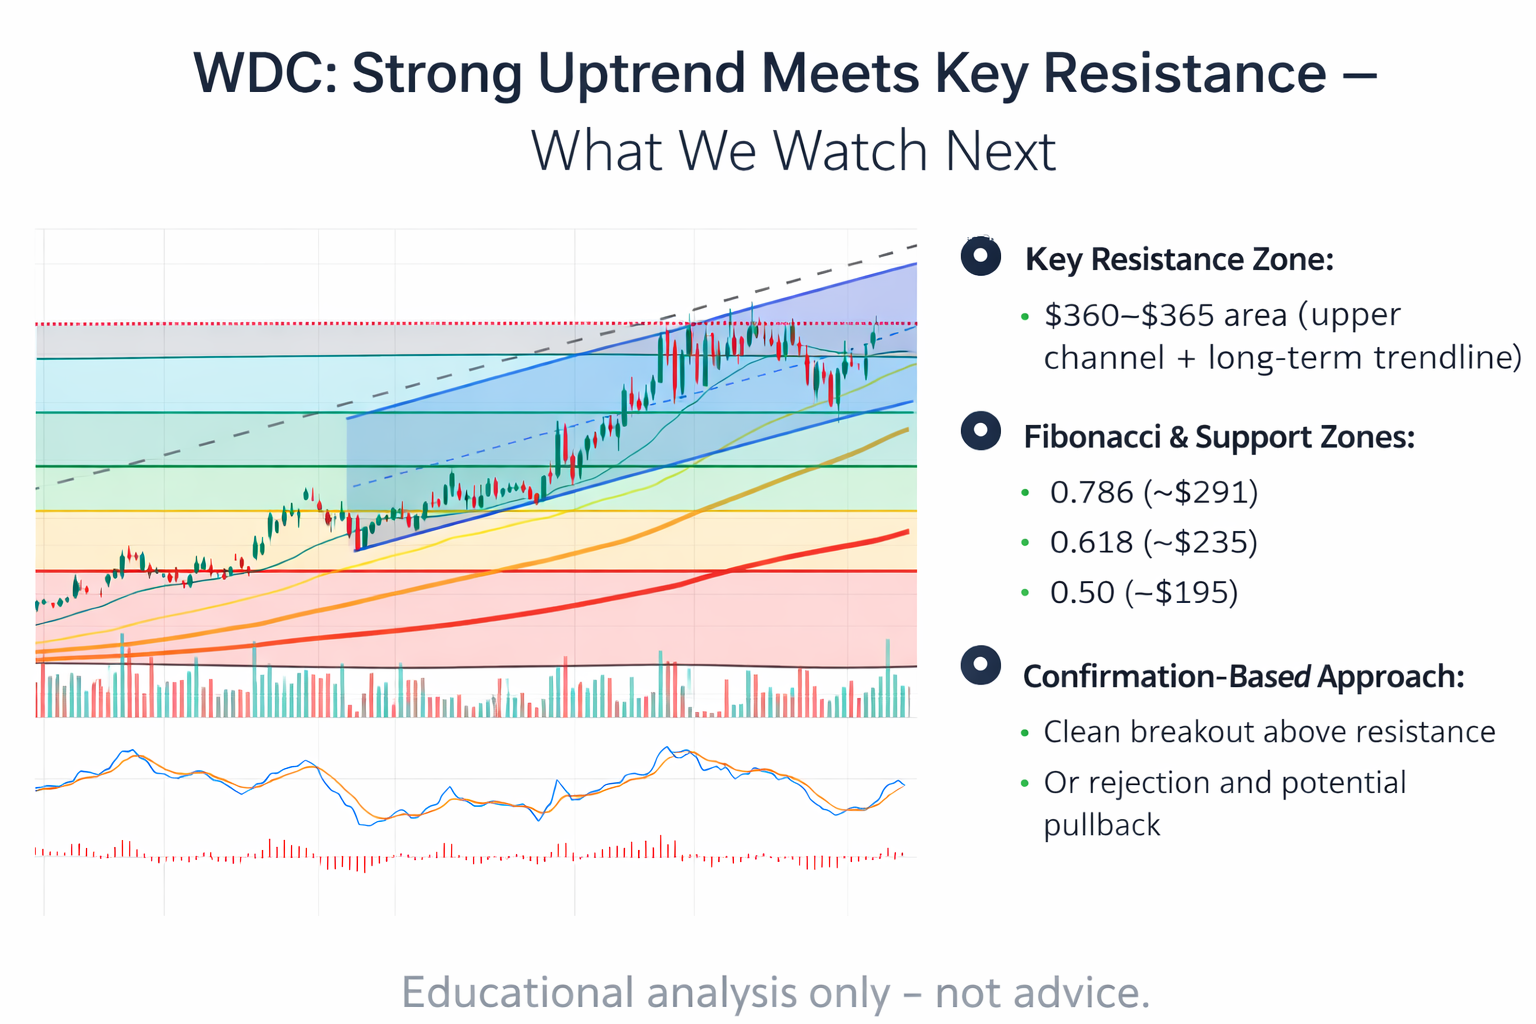
Western Digital (WDC) has delivered a strong bullish move over recent months, supported by both structure and momentum. However, as price approaches a key resistance zone, we are now shifting our focus from trend continuation to confirmation and risk management.
1. Trend Structure: Strong but Extended
The chart shows a well-defined bullish channel, with price consistently respecting higher highs and higher lows. Recently, price has pushed toward the upper boundary of the channel, indicating strong demand but also highlighting a potentially stretched move.
At the same time, we can observe a broader long-term trendline (dashed) acting as dynamic resistance, which aligns closely with the current price area. This confluence increases the importance of this zone.
2. Momentum & Moving Averages
Momentum remains supportive:
- Price is trading above the 20, 50, 100, and 200-day moving averages
- The moving averages are positively aligned, confirming a strong trend
- SMIIO momentum is pointing to the upside, suggesting buyers are still in control
However, when momentum remains strong near resistance, it often requires confirmation before continuation, rather than immediate entry assumptions.
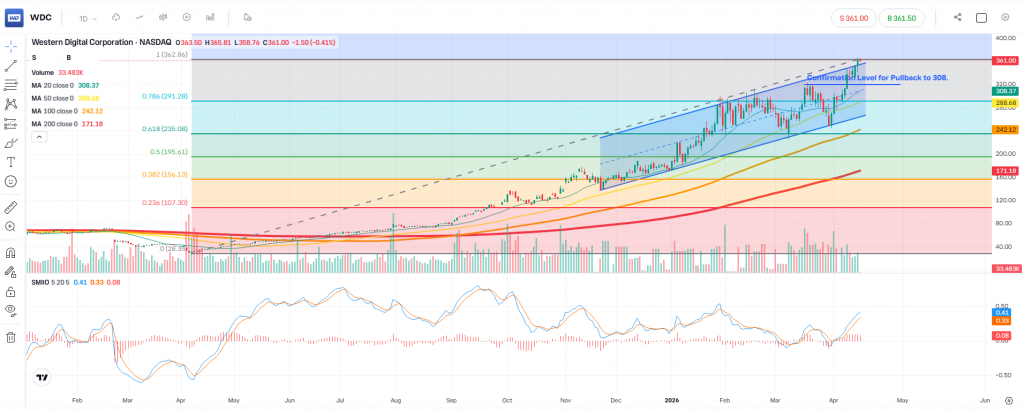
3. Key Resistance Zone
WDC is currently testing a major resistance area around the $360–$365 region.
This level is important because:
- It aligns with the upper channel resistance
- It coincides with the long-term trendline
- It represents a psychological level after a strong rally
This creates a decision zone for the market:
- Either continuation through resistance
- Or rejection leading to a pullback
4. Fibonacci & Support Zones
Using Fibonacci retracement from the broader move, we identify key downside areas:
- 0.786 level (~$291) → First major support zone
- 0.618 level (~$235) → Strong structural support
- 0.50 level (~$195) → Mid-range support and historical reaction zone
Additionally:
- The $288–$308 area aligns with prior consolidation and moving average support
These zones become relevant only if price begins to pull back, helping us understand where demand may re-enter.
5. What We Watch Next (Confirmation-Based Approach)
At this stage, we are not assuming direction — we are waiting for confirmation.
Bullish Continuation Scenario
- A clean breakout above resistance
- Followed by sustained closes above the channel
- Momentum indicators remaining supportive
Pullback Scenario
- Rejection at resistance
- Failure to hold above recent highs
- Gradual move toward key support zones (Fib + MA confluence)
6. Risk Management Perspective
One of the key lessons from this chart is not to chase extended moves.
Even in strong trends:
- Price can retrace sharply from resistance
- Structure can temporarily break before continuation
This is why position sizing and predefined exit levels remain essential. A strong trend does not eliminate risk — it simply changes how we manage it.
Conclusion
WDC remains in a strong bullish structure, but price is now testing a high-confluence resistance zone.
From an educational perspective, this is a classic example of:
- Trend strength meeting resistance
- The importance of confirmation over prediction
- How to use structure, momentum, and Fibonacci together
We continue to monitor whether the market breaks and holds above resistance or rotates into a healthy pullback, as both scenarios are part of normal market behaviour.
Disclaimer:
This analysis is provided for educational and informational purposes only and does not constitute investment advice. Markets involve risk, and past performance is not indicative of future results.
Leave a Reply