Overview
In this analysis, we break down how we are currently reading Meta Platforms (META) from a technical perspective. The chart presents a developing structure where price is attempting to recover, but is still trading within a broader resistance framework.
Our focus is not on predicting, but on understanding structure, confirmation, and risk control.
1. Higher Timeframe Context – Descending Pressure Remains
- A long-term descending trendline is clearly visible, connecting previous highs.
- This suggests that despite recent bullish attempts, the market is still under macro resistance pressure.
- Every rally into this trendline should be treated as a potential rejection zone, not an automatic breakout.
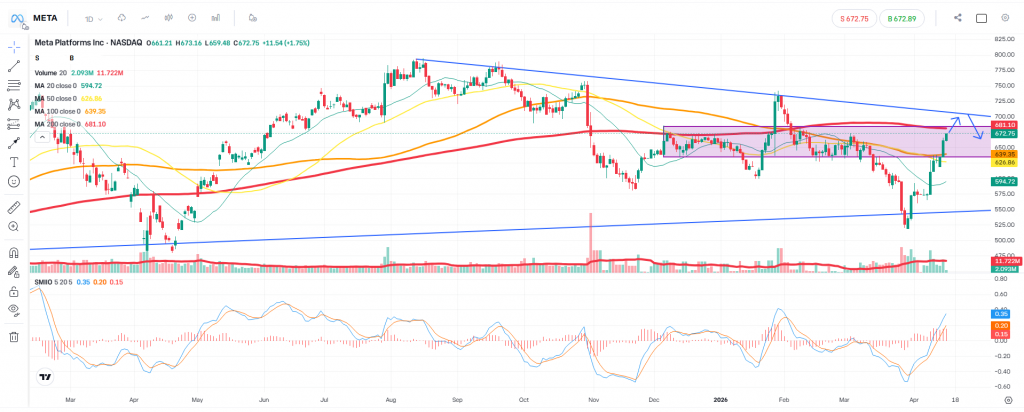
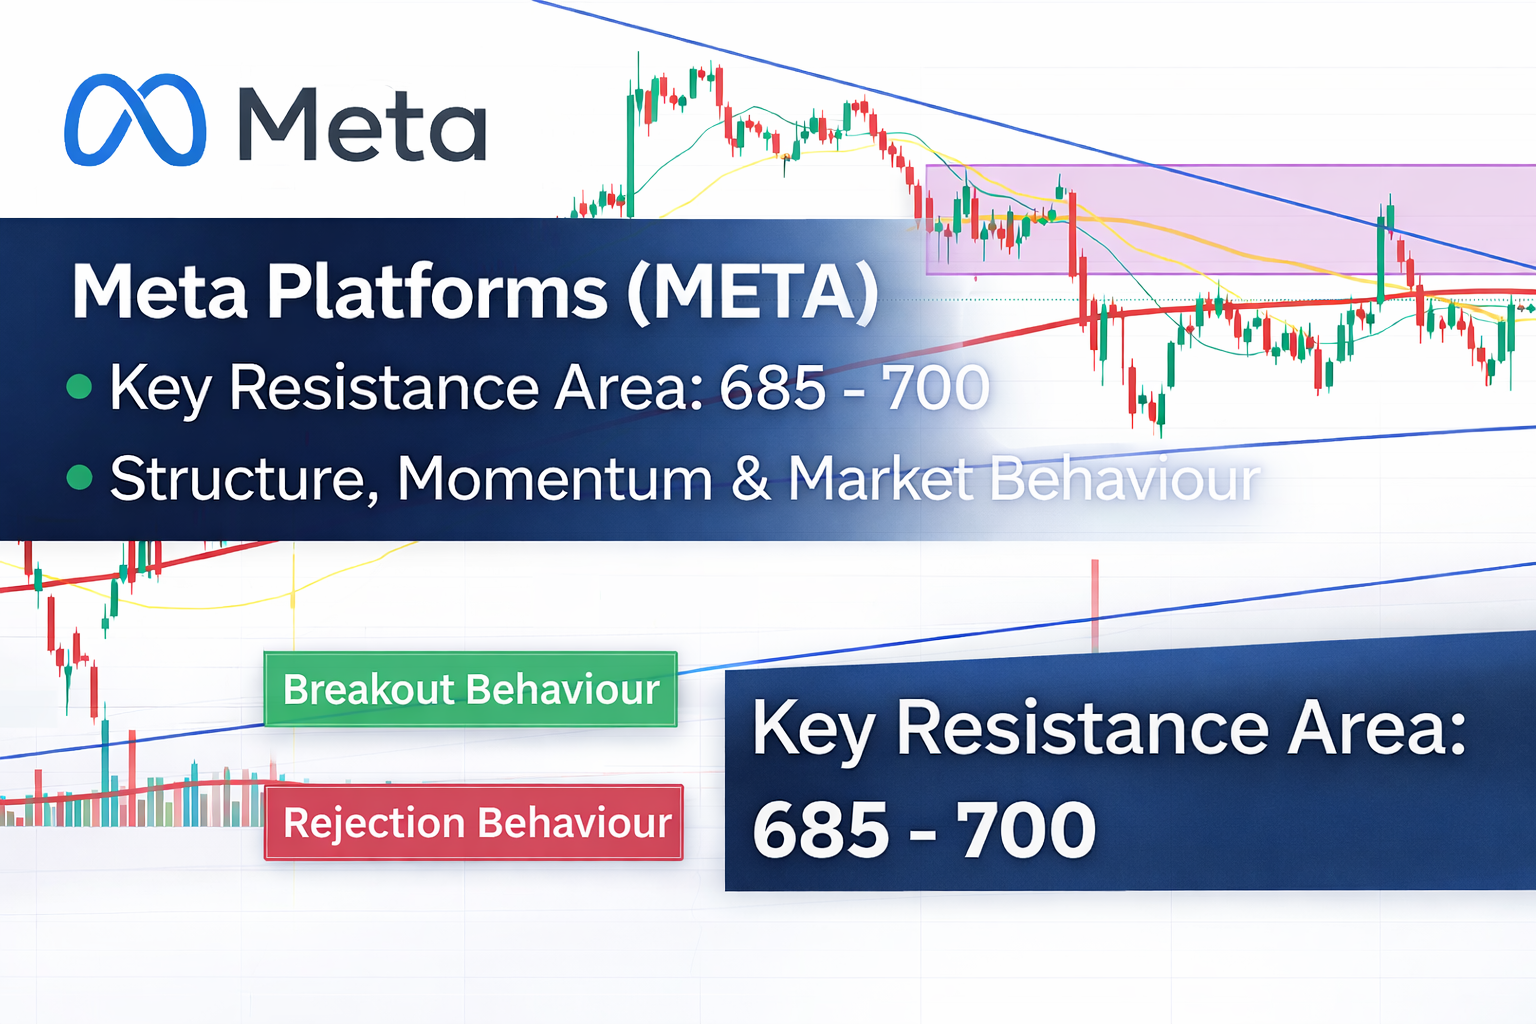
2. Key Resistance Zone: 685 – 700
- The highlighted zone between 685 and 700 stands out as a major supply area.
- This level aligns with:
- Previous price reactions
- The descending trendline
- Psychological round-number resistance
👉 From an educational standpoint:
When multiple resistance factors align, the probability of rejection increases unless strong momentum breaks through.
3. Current Structure – Consolidation & Recovery
- Price has recently bounced strongly from lower levels (~550 area).
- It is now trading inside a short-term consolidation zone (highlighted box).
- This suggests:
- Buyers are attempting to regain control
- But conviction is still limited
📌 Key idea:
Consolidation after a move often leads to either continuation or rejection, depending on confirmation.
4. Moving Averages – Mixed Signals
- 20 DMA (short-term) → Price is now above → short-term bullish momentum
- 50 DMA → Acting as dynamic resistance/support transition
- 200 DMA (~681) → Critical level
👉 The 200 DMA is especially important:
- It often acts as a magnet and decision point
- Rejection here → continuation lower
- Break and hold → stronger bullish structure
5. Momentum (SMIIO Indicator)
- Momentum has turned positive, showing increasing buying pressure
- However:
- This is happening into resistance, not after a breakout
📌 Educational takeaway:
Momentum is more reliable when it confirms structure, not when it fights against major resistance.
6. What We Are Watching Next
We are not assuming direction — we are waiting for confirmation:
Bullish Scenario
- Price breaks and holds above 685 – 700 zone
- Acceptance above the 200 DMA
- Follow-through with higher closes
👉 This would indicate a shift in structure
Bearish Scenario
- Price gets rejected from 685 – 700
- Fails to hold above key moving averages
- Starts printing lower highs
👉 This would confirm continuation of the broader downtrend
Risk Management Perspective
One of the most important lessons from this chart:
Just because price is recovering does not mean the trend has changed.
- Always define:
- Invalidation level
- Position size based on risk
- If structure fails, the exit should be clear and pre-defined
Final Thoughts
META is currently at a decision point:
- Short-term: bullish recovery
- Medium-term: still under resistance
- Long-term: trendline pressure remains
This is exactly the type of environment where patience matters most.
We let the market prove direction first, rather than anticipating it.
Disclaimer
This analysis is for educational and informational purposes only. It does not constitute investment advice, a recommendation, or an offer to buy or sell any financial instrument. All trading involves risk, and past performance is not indicative of future results.
Leave a Reply