
-

Market Structure Overview From a higher timeframe perspective, Capital One Financial Corp (COF) continues to trade within a well-defined weekly bullish channel, maintaining a broader upward structure. More recently, price has rotated back toward the lower bound of this channel, an area that has historically acted as a dynamic support zone. Recent Price Behaviour At…
-

Market Context: From Underperformance to Recovery Iridium Communications has transitioned from a prolonged corrective phase into a strong recovery structure. After an extended downtrend, price action began stabilising and gradually formed a rounded base, a classic transition from distribution to accumulation. What makes this structure particularly interesting is the shift in behaviour: This suggests that…
-

Market Structure Overview Netflix has recently shown a notable shift in structure following a prolonged downtrend. After a strong impulsive move higher, price entered a consolidation phase, forming a bullish flag pattern, which we typically interpret as a continuation structure within trending conditions. The initial upward move (flagpole) reflects strong buying interest, while the consolidation…
-
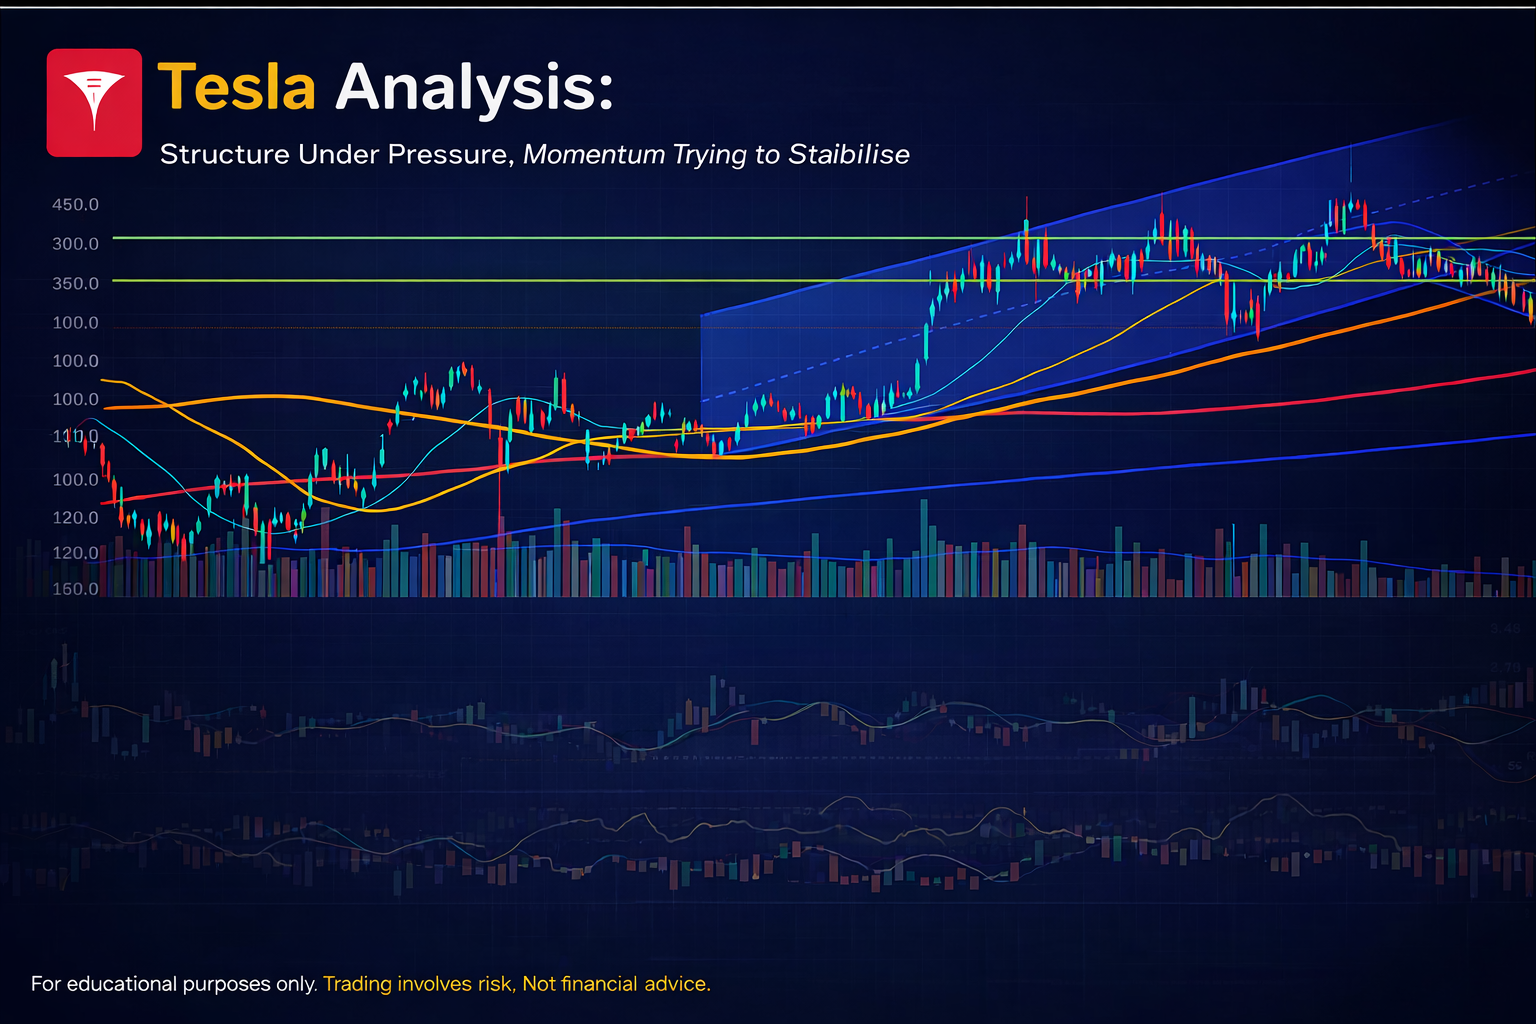
From a structural perspective, Tesla has transitioned from a strong bullish phase into a corrective environment, with price now trading within a short-term descending channel. Trend Shift & Structure The previous bullish channel has clearly broken down, signalling a loss of upward momentum. Since then, price action has been forming lower highs and lower lows,…
-

From our perspective, the current structure in MP Materials is approaching an important technical decision point. After a prolonged period of consolidation within a broader range, price is now attempting to stabilise around the 200-day moving average, which often acts as a key reference level for longer-term direction. Structure Overview Looking at the chart, we…
-

Market Structure Overview Copper remains in a well-defined bullish channel, with price consistently forming higher highs and higher lows over the past months. This structure reflects sustained demand, likely supported by broader macro themes such as industrial recovery and long-term electrification trends. Within this broader uptrend, we can now identify a developing ascending triangle, which…
-

Market Structure Overview From a structural perspective, TSM remains within a well-defined bullish channel, with price continuing to respect both the upper and lower boundaries over the medium to long term. After the strong rally into early 2026, price has entered a consolidation phase, but importantly: This keeps the overall bias in a monitoring phase…
-

Market Context From a structural perspective, Oracle has been in a clear downward phase since September 2025. In this type of environment, we generally avoid anticipating reversals too early, as corrective rallies can often appear convincing before the broader trend resumes. Previous Structure: Bearish Continuation Between November 2025 and January 2026, price attempted to stabilise…
-
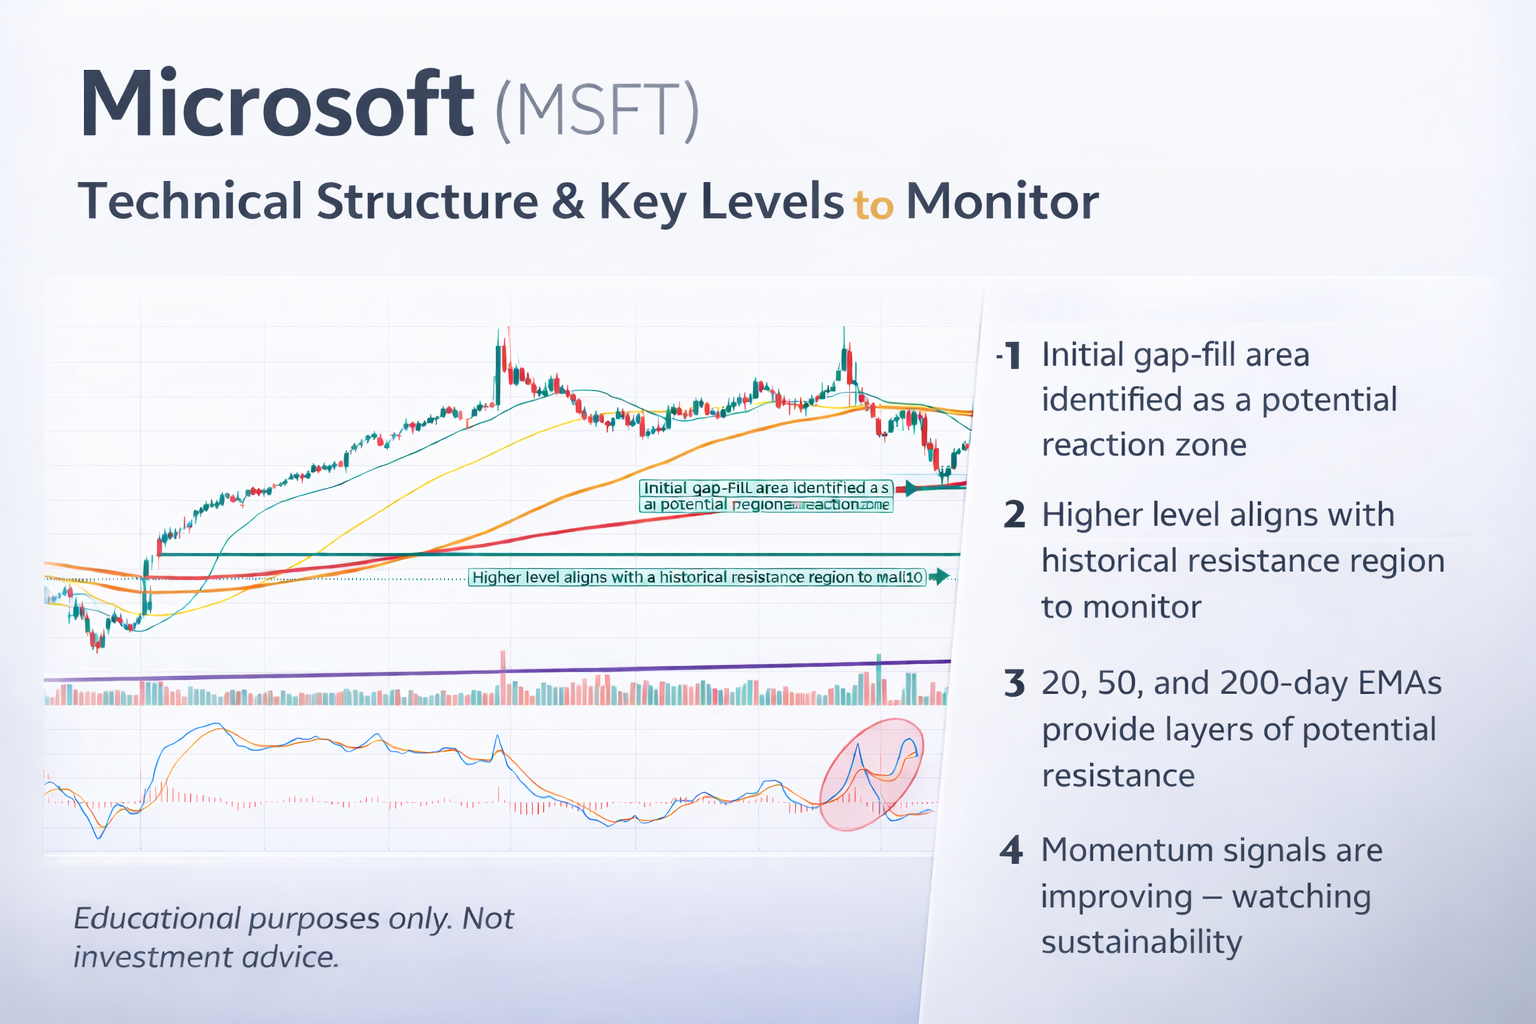
Overview Microsoft’s recent price action shows a recovery phase following a broader pullback, with price attempting to stabilise after a sharp decline. The focus now shifts to how price behaves around key technical zones and whether momentum can sustain. 1. Market Structure Shift After breaking below its previous support structure, the market entered a corrective…
-

Market Context Delta Air Lines (DAL) has been gradually rebuilding its bullish structure after a period of volatility earlier in the year. The recent price action shows a shift towards stability, supported by improving momentum and a clear technical framework forming on the chart. From a broader perspective, airline stocks tend to be sensitive to…