
Market Structure Overview
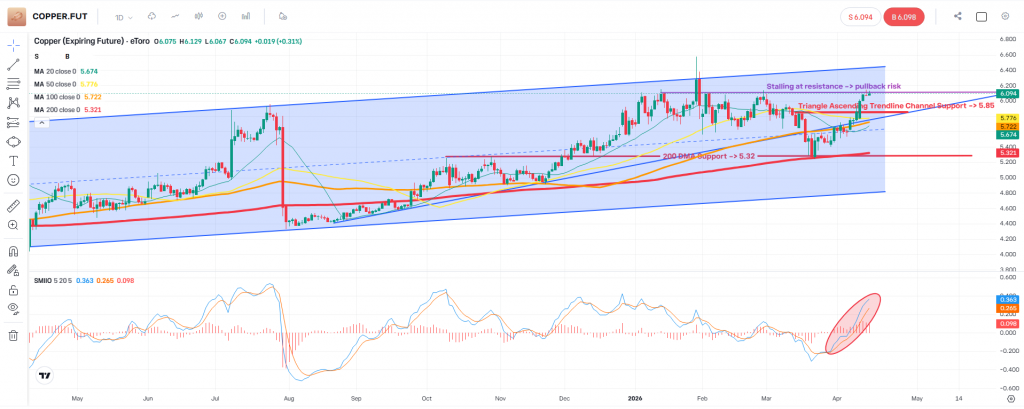
Copper remains in a well-defined bullish channel, with price consistently forming higher highs and higher lows over the past months. This structure reflects sustained demand, likely supported by broader macro themes such as industrial recovery and long-term electrification trends.
Within this broader uptrend, we can now identify a developing ascending triangle, which typically signals accumulation and potential continuation — but only with confirmation.
Current Technical Position
Price is currently testing the upper boundary of the ascending triangle, which also aligns closely with resistance inside the broader bullish channel.
At this stage, the market is showing signs of hesitation, suggesting that this level is not being broken easily.
From a technical perspective, this creates two clear scenarios.
Scenario 1: Rejection and Pullback (Base Case)
If price struggles to break above the triangle resistance, we may see a short-term pullback.
- Initial support sits around 5.85, which aligns with:
- The lower bound of the triangle structure
- Short-term trend support within the channel
This type of pullback would be technically healthy, allowing the market to reset before any further upside attempt.
Scenario 2: Confirmed Breakout and Continuation
If price manages to break above the triangle resistance, we do not assume continuation immediately.
Instead, we wait for confirmation:
- At least two consecutive daily candle closes
- Each candle closing higher than the previous one
This would suggest genuine momentum, rather than a false breakout.
If confirmed, the next area of interest becomes the upper boundary of the bullish channel, which sits around 6.44.
Scenario 3: Breakdown and Deeper Correction
If the structure fails and price moves below the triangle support, confirmation is again key.
We would look for:
- Two consecutive daily closes below the triangle
This would indicate a loss of short-term bullish structure, opening the door for a deeper retracement.
In this case, the next major level to monitor would be:
- 200-Day Moving Average (~5.32)
This level often acts as a dynamic support zone in trending markets.
Momentum Insight
The SMI indicator is currently turning higher, suggesting that short-term momentum is attempting to recover. However, momentum alone is not enough — it must align with price confirmation at key levels.
Our Approach
At this stage, we are not predicting direction — we are reacting to structure.
We focus on:
- Key levels
- Confirmation signals
- Controlled position sizing
Because as always, structure can fail, and risk management remains the most important part of any trading decision.
Conclusion
Copper is approaching a critical technical point, where both continuation and pullback scenarios remain valid.
- Resistance is clearly defined
- Support levels are structured
- Confirmation will determine direction
For now, patience is key — and we let the market show its hand before committing.
Disclaimer
This content is provided for educational and informational purposes only and does not constitute investment advice. Financial markets involve risk, and past performance does not guarantee future results.
Leave a Reply