Overview
Microsoft’s recent price action shows a recovery phase following a broader pullback, with price attempting to stabilise after a sharp decline. The focus now shifts to how price behaves around key technical zones and whether momentum can sustain.
1. Market Structure Shift
After breaking below its previous support structure, the market entered a corrective phase. However, recent candles suggest a short-term recovery attempt:
- Price is rebounding from lower levels
- Short-term momentum is improving
- Buyers are attempting to regain control
That said, the broader structure still reflects caution unless key levels are reclaimed.
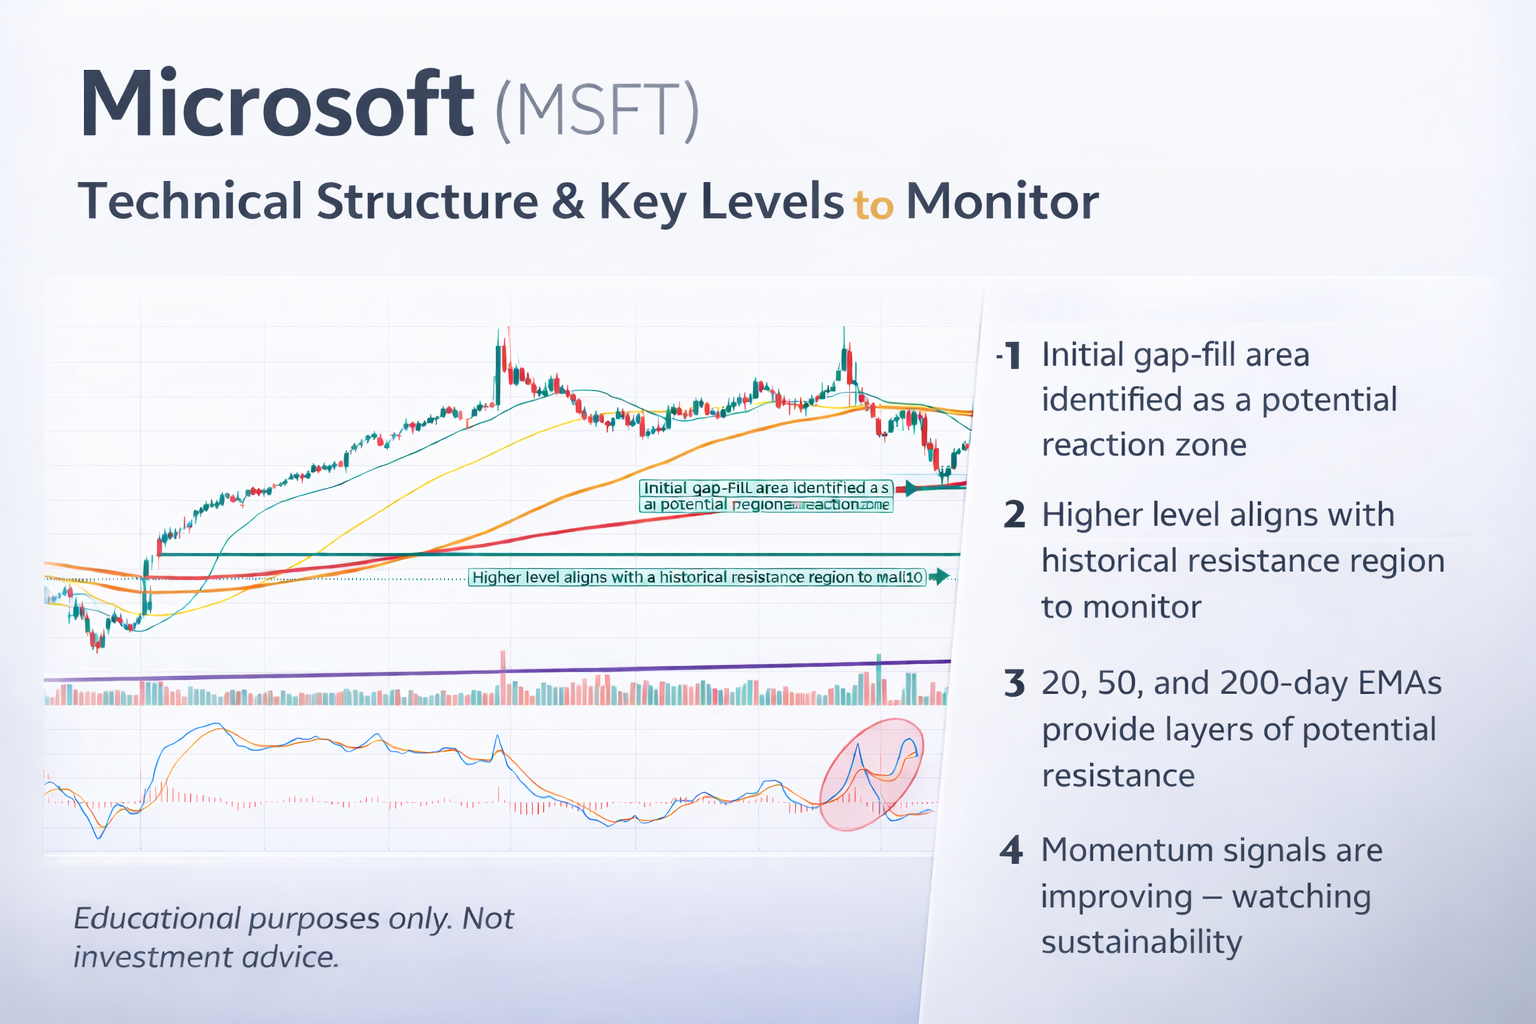
2. Moving Averages as Dynamic Levels
The moving averages are currently acting as layered resistance:
- 20-day MA → being tested in the short term
- 50-day MA → next level of technical pressure
- 200-day MA → longer-term reference point above price
This stacked structure suggests that upside may face friction unless momentum strengthens.
3. Gap Area & Key Zones
Two important levels stand out on the chart:
- Initial gap-fill area
This is the first zone where price may react, as gaps often attract price revisits. - Higher historical resistance zone
This aligns with prior price reactions, making it a level where supply could reappear.
These zones are not predictions but areas where market behaviour becomes more informative.
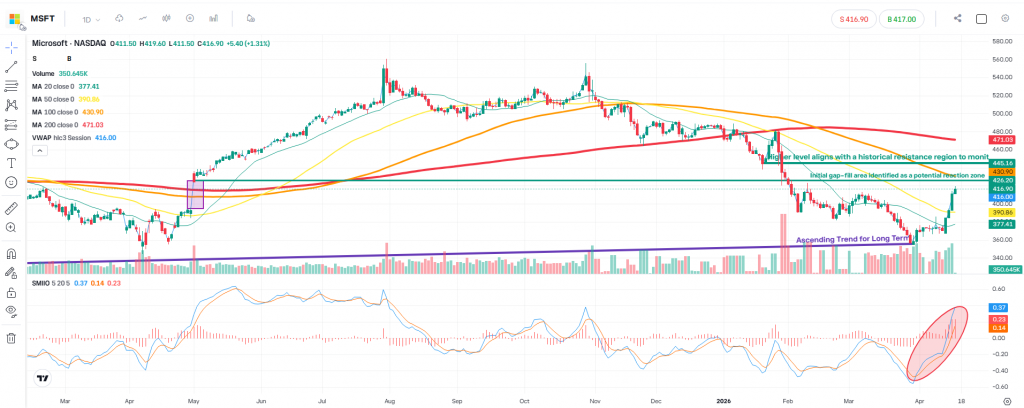
4. Trendline Context
An ascending trendline from the broader structure remains intact:
- This suggests longer-term structure has not fully broken
- Price interaction with this trendline may provide context for continuation or failure
5. Momentum (SMIIO)
Momentum indicators are showing signs of improvement:
- SMIIO is turning higher
- Momentum shift supports the short-term recovery narrative
However, momentum needs to sustain to support any continuation.
What We Are Watching
From our perspective, this is a reaction-based environment, not a predictive one.
We are observing:
- How price behaves at the gap-fill level
- Whether momentum continues to build
- If resistance levels trigger rejection or acceptance
- Alignment between price structure and momentum
Disclaimer
This analysis is for educational and informational purposes only. It reflects how we interpret price action and market structure. It does not constitute investment advice or a recommendation to buy or sell any financial instrument. Always ensure proper risk management and conduct your own research.
Leave a Reply