Understanding the Bigger Picture
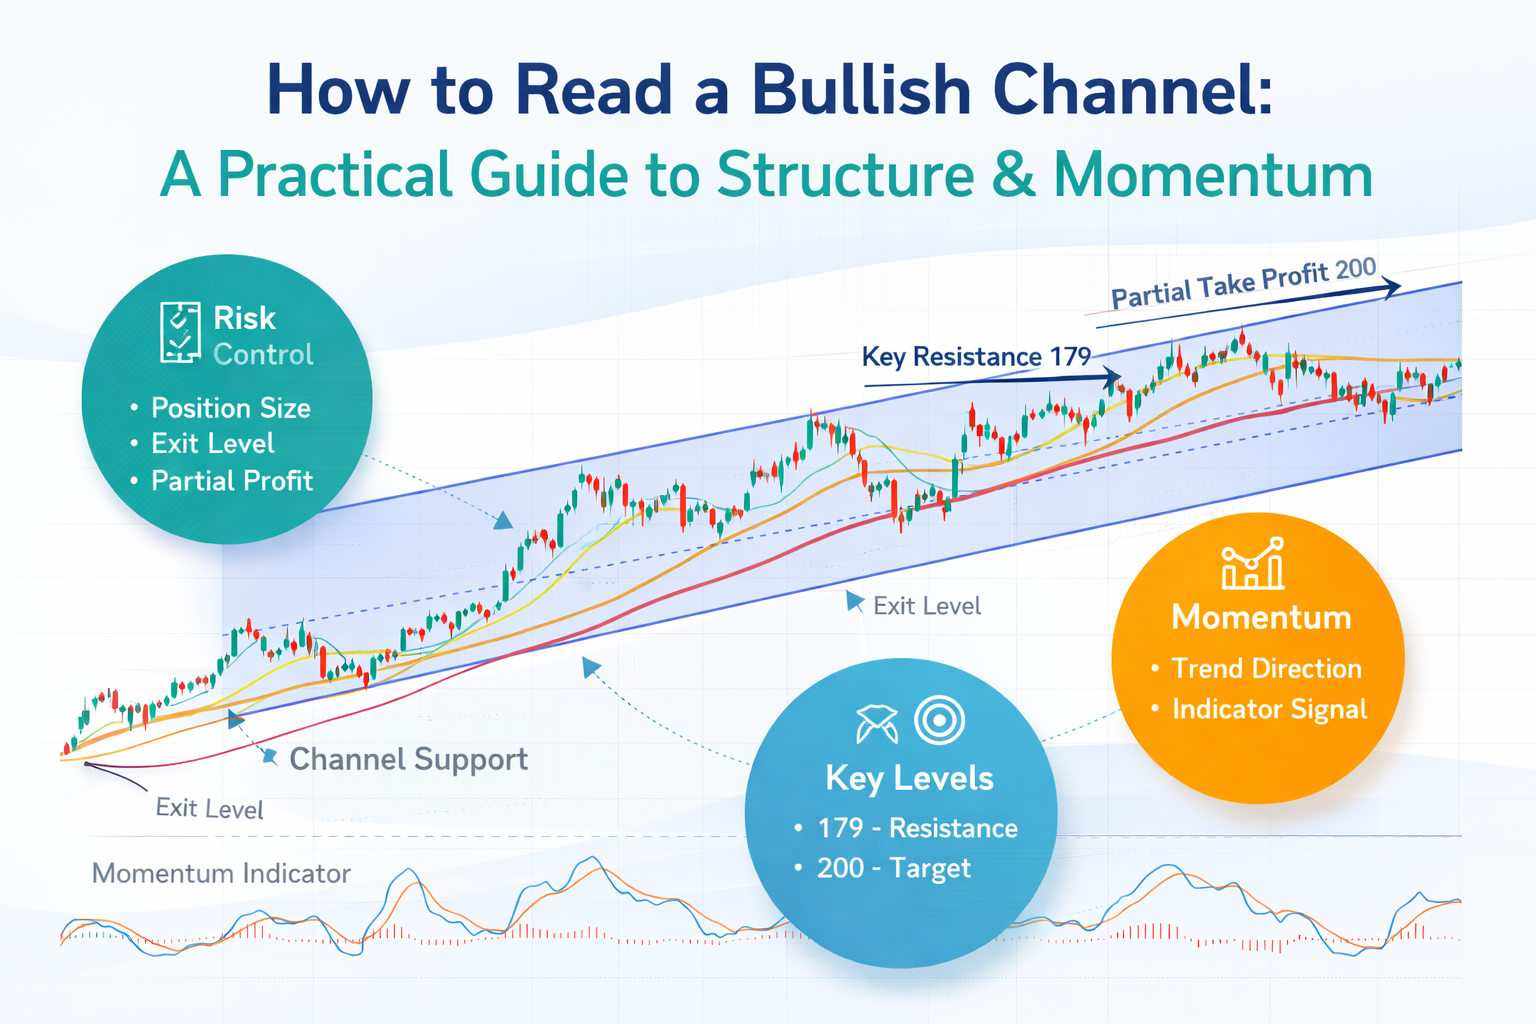
This type of chart represents a well-defined bullish channel, where price consistently respects both the upper resistance and lower support boundaries.
One of the most important observations here is:
Price has repeatedly respected the lower boundary of the channel without breaking it.
However, this does not guarantee continuation.
Markets are dynamic, and structure can fail at any time. This is why we always emphasise:
- Never commit full capital based on structure alone
- Always define your risk before entry
- Position sizing and exit planning come first
A bullish channel is an environment, not a certainty.
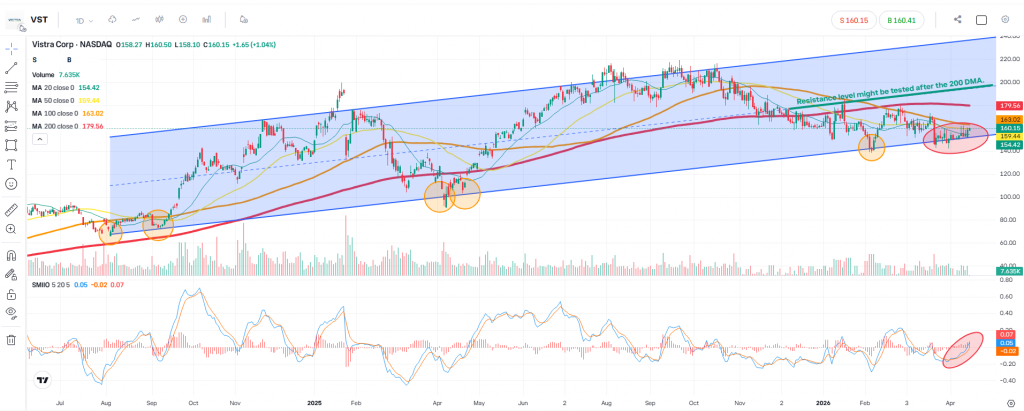
Momentum Confirmation – Using SMIIO
Momentum plays a key role in validating structure.
In this case, the SMIIO indicator has been consistently supporting the direction of price:
- Momentum shifts align with upward moves
- Pullbacks show weakening momentum before continuation
This helps us avoid blindly trading the channel and instead wait for alignment between structure and momentum.
Moving Averages – Dynamic Support & Direction
We use moving averages to understand trend strength and positioning:
- 20-Day Moving Average
Price holding above this level shows short-term strength - 50-Day Moving Average
Price approaching or reclaiming this level suggests momentum rebuilding - 200-Day Moving Average
This is where things get interesting.
The 200 DMA often acts as a magnet for price.
In this chart, the 200 DMA sits around 179, making it a natural area where:
- Price may be drawn toward it
- Reactions or slowdowns can occur
Key Levels & Trade Management Thinking
Rather than predicting, we focus on reaction zones:
1) First Key Area – Around 179
- Aligns with the 200 DMA
- Acts as a magnet and potential resistance
- A logical zone to consider partial profit-taking
2) Second Key Area – Around 200
- Sits near the midpoint of the bullish channel
- Historically, mid-channel levels can act as decision zones
- Price may:
- Pause
- Consolidate
- Or face rejection
Risk Management – The Non-Negotiable Rule
Even in a clean bullish structure:
- The channel can break
- Momentum can shift suddenly
That’s why our approach is always:
- Define the exit level before entry
- Accept that losses are part of the process
- Size positions so that one trade does not impact overall capital significantly
Trading is not about being right every time — it’s about staying in the game long enough to benefit from your edge.
Final Thoughts
This type of setup teaches us an important lesson:
- Structure gives us context
- Indicators give us confirmation
- But risk management protects us
We do not predict the market.
We observe, react, and manage risk accordingly.
Disclaimer
This content is provided for educational and informational purposes only and does not constitute investment advice or a recommendation to buy or sell any financial instrument. Markets involve risk, and past performance is not indicative of future results. Always manage your risk and position sizing accordingly.
Leave a Reply