How We Build the Parallel Channel (Step-by-Step)
In this analysis, we take a slightly different, and more structured, approach.
- First, we connect the lower lows to define the true directional base of the trend
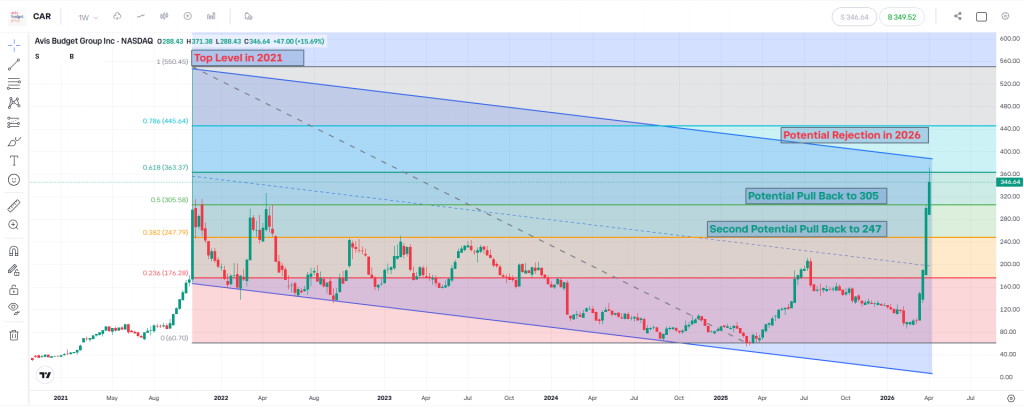
- Then, we drag a parallel line upward to the major top formed in 2021
👉 This gives us a projected upper boundary, which helps identify where price could react in the future.
This is key:
We are not reacting to price — we are projecting structure forward.
Why the 2026 Level Matters
By extending this parallel channel, we can see that price is now approaching a potential upper boundary in 2026.
This level is important because:
- It originates from a clean structural projection
- It aligns with a historical extreme (2021 top)
- It represents a zone where momentum may slow or reverse
👉 In simple terms:
This is where buyers may become exhausted, and sellers may reappear.
Vertical Rally = Higher Pullback Probability
One of the most important observations on this chart is the recent vertical move.
When price rises aggressively:
- It creates inefficiency (imbalance)
- It moves faster than structure can support
- It often leads to a corrective phase
👉 That’s why pullbacks are not just possible, they are probable.
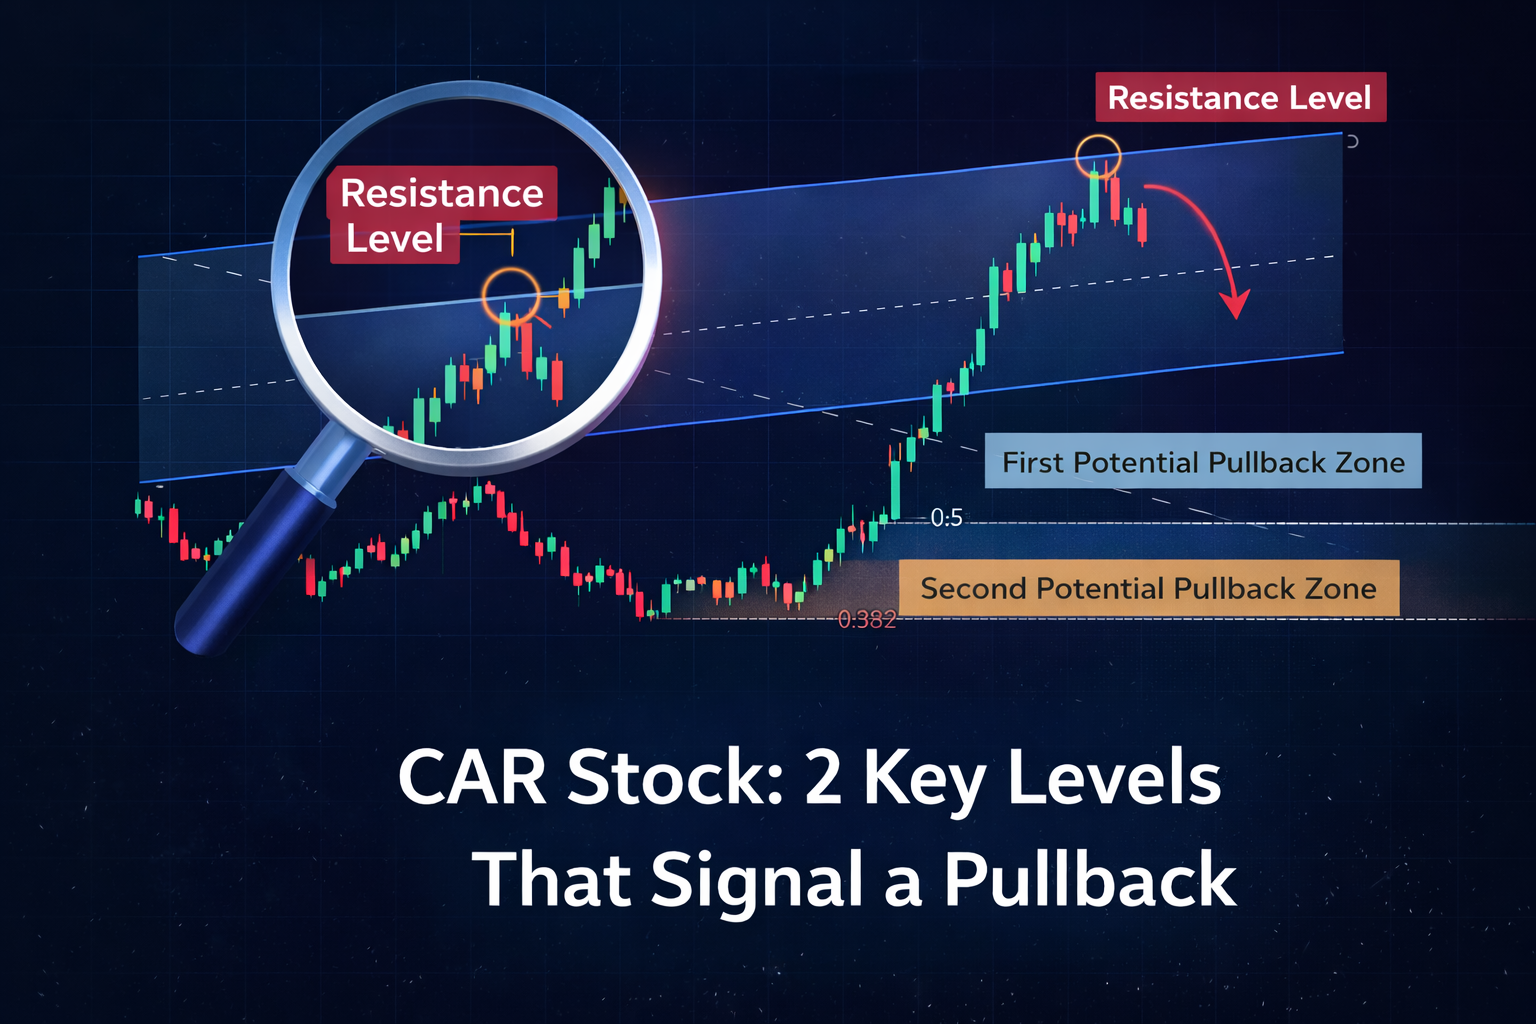
High-Probability Pullback Zones (Fibonacci Confluence)
Using Fibonacci retracement from the recent move:
- First pullback zone: 305 (0.5 level)
- Second pullback zone: 247 (0.382 level)
These levels matter because they:
- Sit within the broader channel structure
- Act as natural rebalancing zones
- Are commonly watched by market participants
👉 We are not predicting, we are identifying areas of interest.
What We Are Watching Next
At this stage, the key question is:
- Will price reject from the channel resistance?
- Or will it break and shift structure?
Scenario 1: Rejection
- Pullback towards 305
- Potential continuation towards 247 if momentum weakens
Scenario 2: Breakout
- Acceptance above the channel
- Structural shift → bullish continuation → exit if the price goes above the parrallel.
Risk Management Perspective
No setup is complete without risk consideration.
- A strong rejection supports the pullback scenario
- A clean breakout and hold above the channel invalidates it
👉 This is why:
- We focus on reaction, not prediction
- We always adjust position size based on structure risk
Key Takeaways
- Parallel channels can be used to project future resistance
- CAR is currently testing a projected upper boundary from 2021
- The recent vertical rally increases pullback probability
- Key levels to watch: 305 and 247
- The focus remains on structure, momentum, and reaction
Disclaimer
This content is provided for educational and informational purposes only and does not constitute investment advice. Markets involve risk, and past performance is not indicative of future results. Always manage your risk and position sizing accordingly.
Leave a Reply