This is an educational piece where we share our approach to reading and interpreting price structure.
We are currently analysing Zebra Technologies (ZBRA) from a pure price action perspective, focusing on structure, confirmation, and measured projections rather than speculation.
1) Key Support Formation
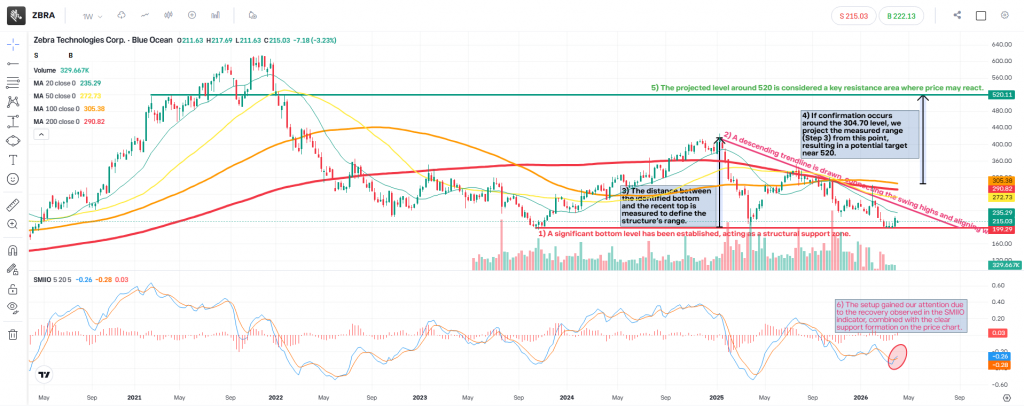
A significant bottom level has been established, which acts as a structural support zone.
This level is important as it defines the base of the current range and becomes the reference point for any future projections.
2) Descending Trendline Resistance
A descending trendline is clearly visible, connecting the recent swing highs and aligning with the upper wicks of the candles.
This tells us:
- Sellers are still active on rallies
- The market remains under downward pressure unless this trendline is broken
- When the descending trendline is broken, we need to wait at least 2 candle sticks that close higher than the previous one.
3) Measuring the Range
We measure the distance between the bottom and the recent top, which gives us the structure’s range.
This step is key because:
- It allows us to quantify the move
- It forms the basis for any objective target projection
Projection & Scenario Planning
4) Target Projection (If Confirmed)
If price confirms strength around the 304.70 level as an example, we can project the measured range (from Step 3) upward.
This gives a potential upside target near 520.
Important point:
This is not a prediction — it is a conditional projection based on confirmation.
5) Key Resistance Zone
The 520 region becomes a major potential resistance level, where price may:
- Slow down
- Consolidate
- Or reverse
This is where we would expect market reactions, not blind continuation.
Momentum & Confluence (SMIIO Insight)
6) Why This Setup Matters
What brought this chart to our attention is the confluence between price and momentum:
- The SMIIO indicator shows signs of recovery
- Price has respected a key support level
This combination suggests:
- Selling pressure may be weakening
- A potential shift in momentum could be developing
However, without confirmation, this remains a developing structure.
Our Approach
At FXEQ, we:
- Do not predict, we react to confirmation
- Focus on structure + momentum alignment
- Use measured moves to define objective targets
- We wait for Moving Averages to confirm in this example
- Always prioritise risk management and position sizing
Final Thoughts
ZBRA is currently at an interesting point where:
- Support is holding
- Resistance is clearly defined
- Momentum is attempting to shift
The next move will depend on whether price can:
- Break above the descending structure
- Hold above key levels with confirmation
- Wait for the price goes above the Moving Averages with Volume
Until then, we remain patient and reactive, not predictive.
Disclaimer
This analysis is provided for educational and informational purposes only and does not constitute investment advice, a recommendation, or an offer to buy or sell any financial instrument. Markets involve risk, and past performance is not indicative of future results. Always manage your risk and position sizing accordingly.
Leave a Reply