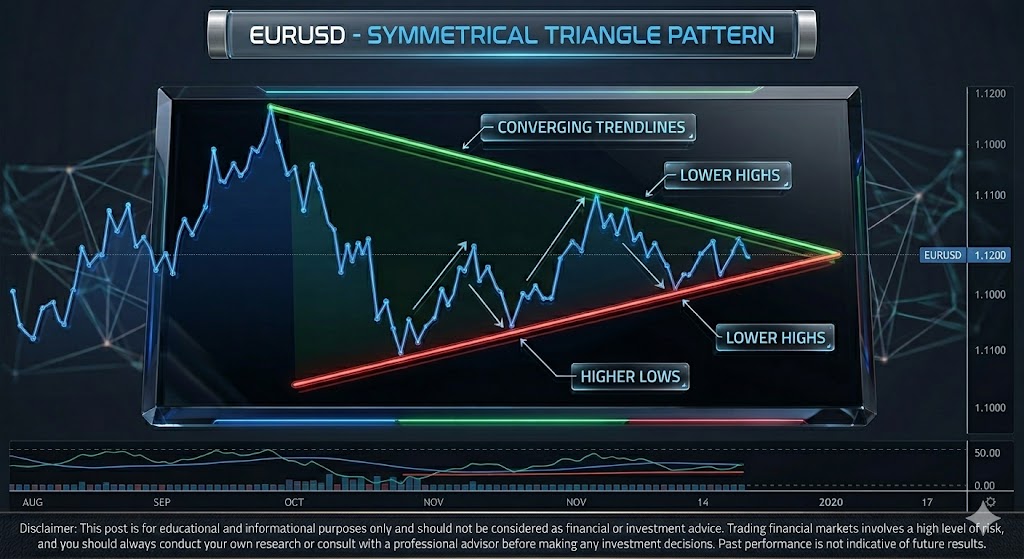
Symmetrical triangles are classic technical chart patterns representing a period of market consolidation and intense indecision between buyers and sellers. When price action finally breaches one of these boundaries, it frequently signals the start of a powerful, directional trend.
Below, we break down the current technical setup on the EUR/USD daily chart using a simple, actionable 4-step framework.
The Technical Setup: A 4-Step Breakdown
1. Descending Resistance
The upper boundary of the triangle connects a series of lower highs. This trendline demonstrates that sellers are progressively stepping in earlier, capping any upside momentum.
2. Ascending Support
The lower boundary connects a series of higher lows, showing buyers defending higher prices during the consolidation phase. The squeeze between Step 1 and Step 2 highlights the market’s narrowing range.
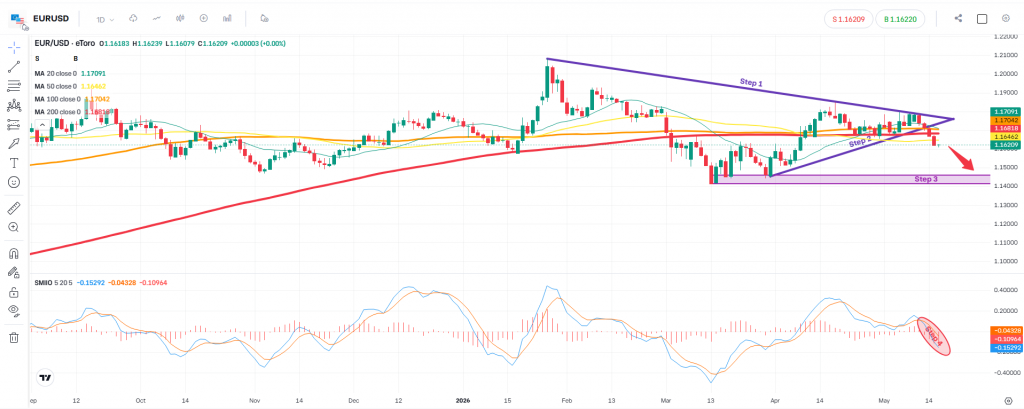
3. Horizontal Support Zone
Located around the 1.1400 – 1.1450 area, this represents a crucial historical demand zone. It has previously acted as a rock-solid price floor and serves as the ultimate target for sellers.
4. Momentum Indicator (SMI)
At the bottom of the chart, the Stochastic Momentum Index (SMI) is delivering a bearish crossover and turning sharply lower. This technical shift indicates that downward momentum is accelerating just as price tests structural support.
| Technical Element | What to Watch For | Market Significance |
| The Breakout Candle | A decisive daily candle close below the ascending support line (Step 2). | Signals that sellers have officially broken the equilibrium and taken market control. |
| Moving Average Confluence | Price slipping and closing below key moving averages (e.g., 20, 50, and 200 MAs). | Reinforces the bearish bias, turning dynamic support into future resistance. |
| Downstream Targets | Price moving toward the horizontal demand zone (Step 3). | Provides a structural profit-taking target for short positions based on historical buyers. |
Risk Management First
While chart patterns offer excellent structural context, they are maps of probability, not guarantees. Professional trading requires a defensive mindset.
⚠️ Key Risk Considerations:
- False Breakouts (Bear Traps): Markets frequently push below a support line to hunt liquidity, only to aggressively reverse back upward.
- Seeking Confirmation: To avoid traps, many traders wait for a daily candle to close well outside the pattern, or wait for a post-breakdown retest of the broken trendline as new resistance.
- Stop-Loss Placement: In a downside breakout scenario, standard risk management involves placing a stop-loss back inside the triangle or just above the most recent minor swing high.
Disclaimer
This post is for educational and informational purposes only and should not be considered financial or investment advice. Trading financial markets involves a high level of risk. Always conduct your own research or consult with a licensed professional before making investment decisions. Past performance is not indicative of future results.
Leave a Reply