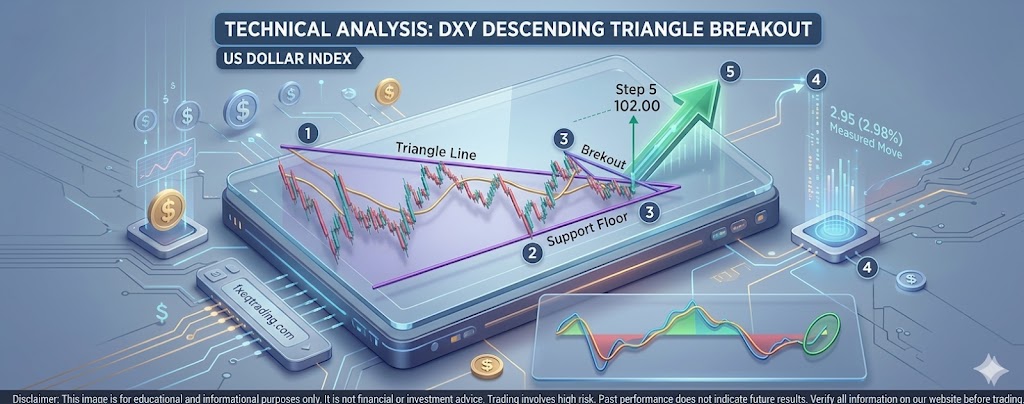
Traders, let’s break down the recent price action on the US Dollar Index (DXY). We are looking at a classic descending triangle breakout setup that is currently unfolding.
Here is your step-by-step guide to reading this pattern and what it means for the next major move:
The Breakout Breakdown
- Step 1: The Descending Resistance Notice the purple downward-sloping trendline. This represents a series of lower highs, showing that sellers have been aggressively pushing the price down every time it tried to rally.
- Step 2: The Flat Support Floor Look at the horizontal purple line sitting right around the $98.15 – $98.20 level. This acted as a strong demand zone where buyers consistently stepped in to protect the floor.
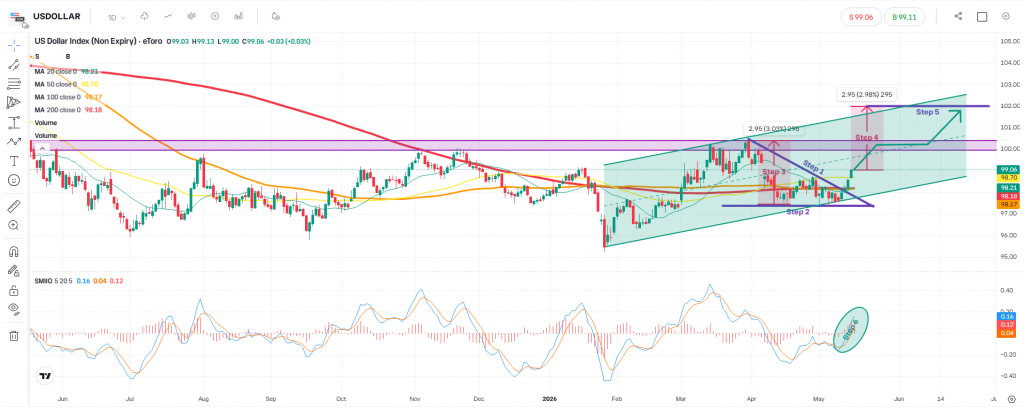
- Step 3: The Breakout Price got squeezed into the apex of the triangle until it finally forced a decision. The DXY cleanly broke above the descending resistance line, signaling a clear shift in momentum from sellers to buyers.
- Step 4: The Measured Move To calculate where this breakout could lead, we measure the “height” of the triangle (the distance from the initial high to the support floor). On this chart, that measures out to roughly 2.95 points (2.98%).
- Step 5: The Projected Target By projecting that 2.95-point height upward from the breakout point, we get our major upside target: right around the $102.00 psychological resistance level.
- Step 6: Momentum Confirmation Look down at the SMI Ergodic Indicator (SMIIO). The bullish crossover and upward slope (circled in green) confirm that positive buying momentum is backing up this breakout.
Key Levels at a Glance
| Technical Element | Price Level / Value | Significance |
| Support Floor | $98.15 – $98.20 | Strong historical demand zone |
| Pattern Height | 2.95 points (2.98%) | Used to calculate the measured move |
| Upside Target | ~$102.00 | Major psychological resistance |
| Momentum (SMIIO) | Bullish Crossover | Confirms buying volume supports the breakout |
Comments & Trading Takeaways
- Watch the Retest: Breakouts often see a brief retest of the old resistance line (now turned support). Keep a close eye on price stability if it dips back toward the trendline.
- Volume Matters: A sustained move toward the $102.00 target will require continued backing from the SMIIO momentum indicator. If momentum flattens, the breakout could stall.
Disclaimer: This post is for educational and informational purposes only and should not be considered as financial or investment advice. Trading financial markets involves a high level of risk, and you should always conduct your own research or consult with a professional advisor before making any investment decisions. Past performance is not indicative of future results.
Leave a Reply