

Bloom Energy Corp (BE) has caught the market’s attention following an aggressive upside expansion that drove price action well outside its long-term structural boundaries. While the underlying momentum is undeniably strong, chasing parabolic moves rarely offers a sustainable risk-to-reward ratio for disciplined market participants.
By analysing historical price action, structural channels, and key moving averages, we can map out a high-probability execution strategy that prioritises risk management.
The Structural Framework
To understand the current technical landscape, we break the chart down into three core components: the ascending channel, historical horizontal levels, and institutional moving averages.
1. The Ascending Channel
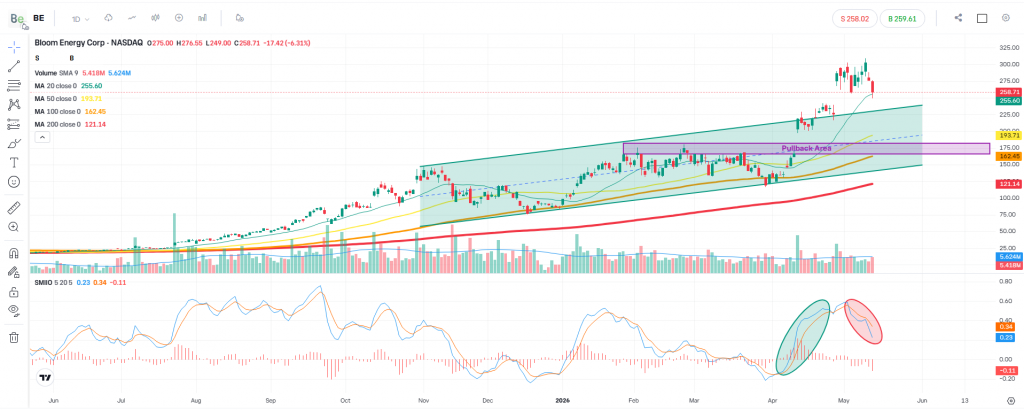
By connecting the major daily higher-lows stretching back across the daily chart and projecting a parallel upper boundary anchored to the November 2025 peak, we establish a well-defined bullish channel. This channel served as the primary framework for BE’s steady uptrend before the recent explosive breakout.
2. The 167 – 182 Structural Pivot (The Gap Fill)
The highlighted purple corridor between 167 and 182 represents a critical technical confluence zone for two distinct reasons:
- Historical Resistance: This zone previously served as a heavy supply ceiling. In technical analysis, broken resistance frequently flips to act as structural support upon a retest.
- The Liquidity Gap: Just before the asset accelerated out of its ascending channel, it left a noticeable price gap within this exact range. Gaps inherently act as magnets for corrective price action, offering a natural area for buyers to re-enter.
3. The 200-Day Moving Average (DMA)
Currently tracking well below the current price, the 200 DMA serves as our ultimate line of demarcation between a healthy bullish retracement and a broader structural regime change.
Execution and Risk Management Strategy
Rather than entering at multi-month highs, a professional framework relies on a multi-tiered entry plan to build a position safely.
Step 1: The Primary Entry (The Retest)
The initial order allocation is reserved for a measured pullback into the 167 – 182 structural zone. We patienty await a retest of this purple region to capitalise on the old resistance turning into support, combined with the filling of the daily price gap.
Step 2: The Secondary Entry (Channel Support)
Should market volatility cause a deeper retracement, the second tier of exposure will be triggered if the price tests the bottom support line of the ascending channel. This allows for a highly optimised average entry price within an established uptrend.
Step 3: Hard Risk Invalidation
Capital preservation is paramount. The invalidation thesis is quantitative and objective: if the price registers two consecutive daily candlestick closes below the 200 DMA, the bullish structure is considered broken. The position will be closed immediately to contain capital loss.
Step 4: Profit Targets and Trade Management
- Minimum Target: 300. This psychological and structural level represents the primary objective for the expansion move.
- Trailing Stop Deployment: Upon testing the 300 threshold, a strict trailing stop-loss mechanism will be implemented. This protects accrued profits while leaving the remaining capital exposed to capture any extended upside.
Strategy Summary
| Parameter | Technical Level / Condition | Strategic Rationale |
| Initial Accumulation Zone | 167 – 182 | Retest of historical resistance floor and daily price gap fill. |
| Secondary Add-on Zone | Ascending Channel Baseline | Trendline support confluence within the primary structural channel. |
| Invalidation Metric | 2 Consecutive Daily Closes < 200 DMA | Structural regime shift; invalidates the medium-term bullish bias. |
| Primary Upside Target | 300 Minimum | Key psychological milestone and structural expansion target. |
| Trade Management | Trailing Stop-Loss | Activated post-target to capture unrestricted macro upside. |
Disclaimer: The analysis presented on fxeqtrading.com is for educational and informational purposes only. It does not constitute independent financial advice, investment recommendations, or an endorsement to buy or sell financial instruments. Financial trading carries a high level of risk to your capital, and you should only trade with capital you can afford to lose. If you are unsure of any investment decision, please consult a certified independent financial adviser.
Leave a Reply