
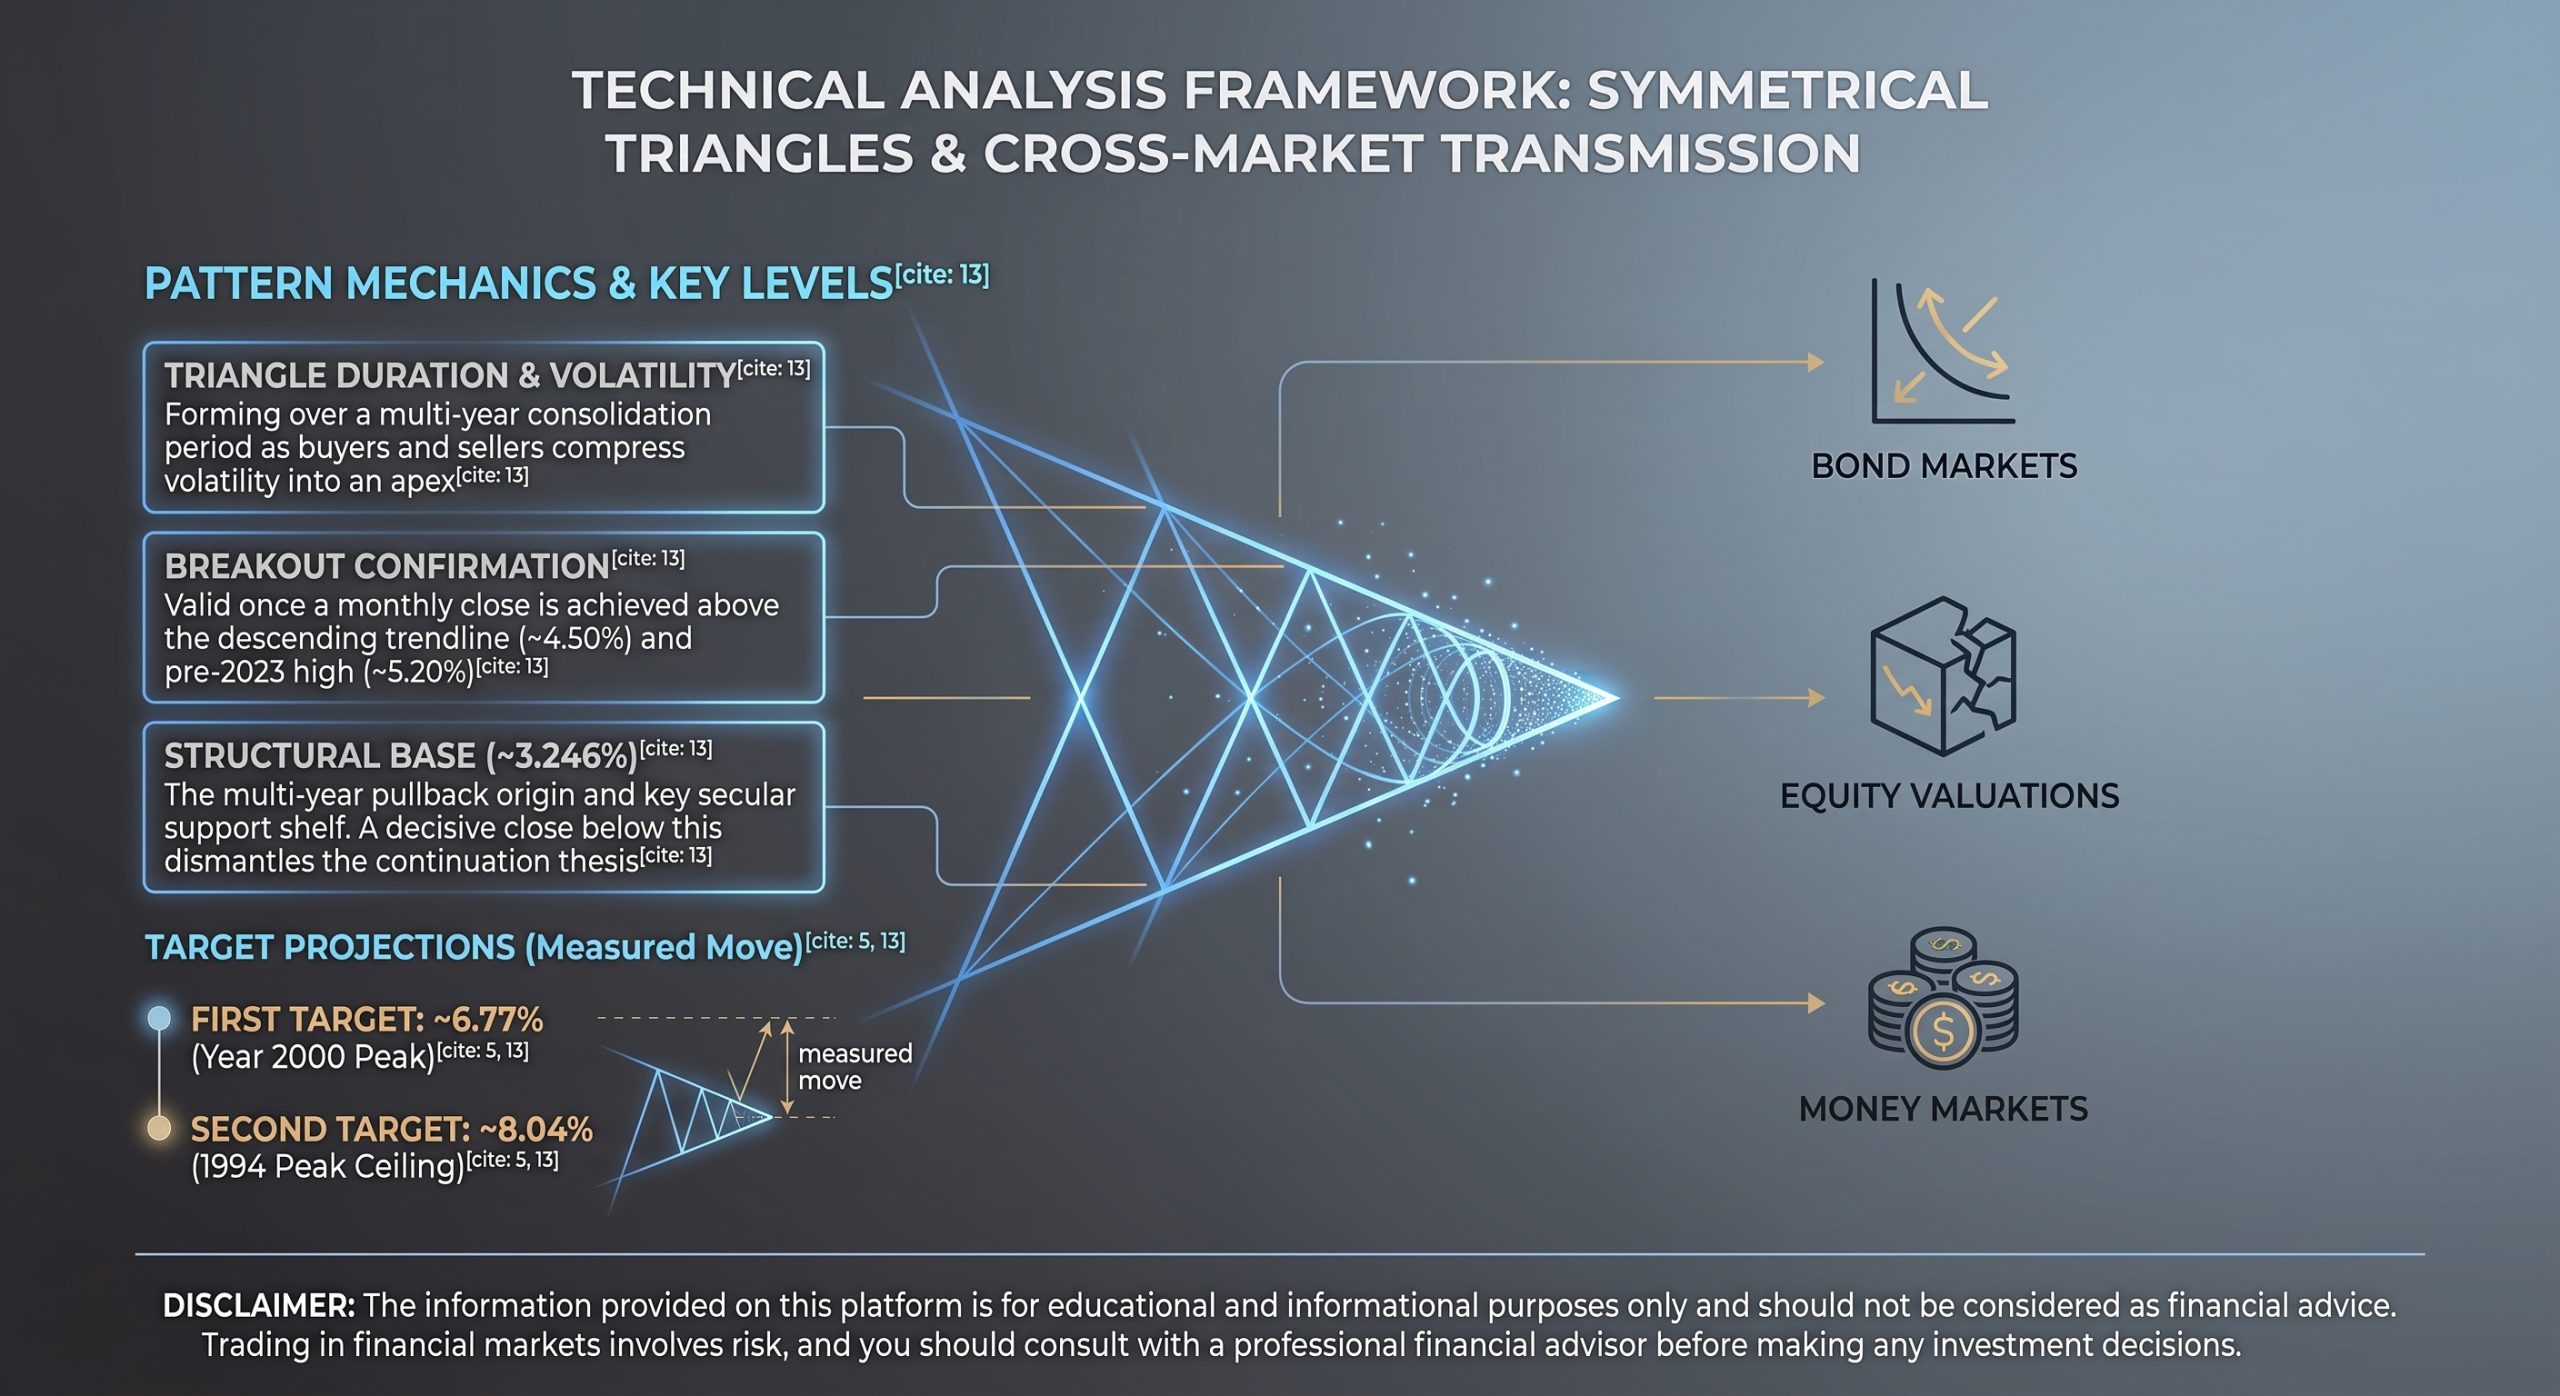
Cross-Market Transmission: How Benchmark Yields Impact Bonds, Stocks, and Money Markets
The US 10-Year Treasury yield is the foundational benchmark for global cost of capital. When yields break out from multi-year consolidations into higher secular ranges, the transmission across the financial system is direct and systemic:
- The Bond Market (Price Contraction & Duration Risk):
- Mechanism: Bond prices and yields share an inverse relationship. As the 10-year yield surges toward target resistance zones (~5.25% to 6.77%), existing fixed-rate bonds suffer structural capital depreciation.
- Impact: Longer-duration instruments absorb severe mark-to-market drawdowns. Concurrently, corporate issuers face significantly wider refinancing spreads, raising debt-servicing overhead.
- The Stock Market (Valuation Compression & Capital Rotation):
- Mechanism: The 10-year yield serves as the global risk-free rate in Discounted Cash Flow (DCF) models. When yields climb, future corporate earnings are discounted at a higher rate, which mechanically lowers the net present value (NPV) of equities.
- Impact: High-multiple growth equities and speculative tech endure the sharpest multiple compression. The Equity Risk Premium (ERP) narrows, triggering capital rotations out of extended equities and into defensive, cash-flow-rich sectors or direct credit.
- The Money Market (Cash Allocation & Liquidity Drain):
- Mechanism: Expanding sovereign yields pull yields on short-term paper (Treasury bills, commercial paper) higher. This strengthens the ‘risk-free hurdle rate’ that all risk assets must beat.
- Impact: Capital flows heavily into money market funds and short-dated cash instruments. With cash offering competitive real yields without duration or equity volatility, risk-taking becomes expensive, draining marginal liquidity from speculative financial markets.”
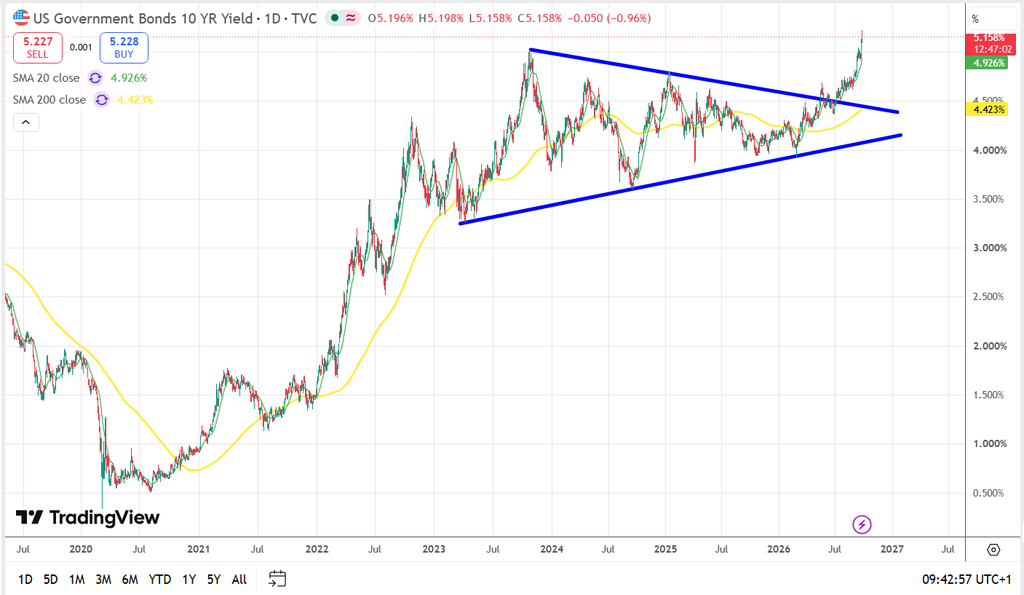
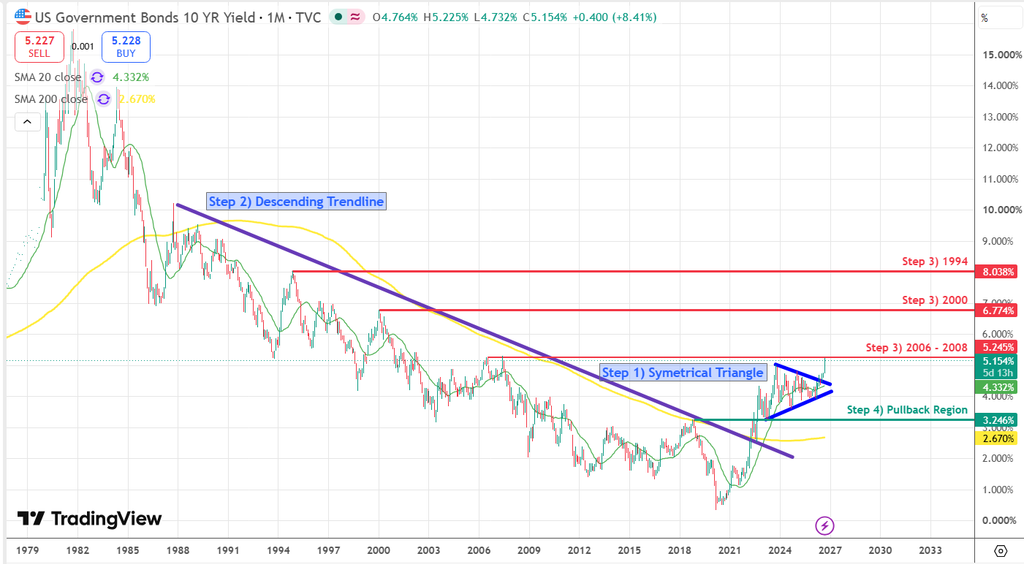
Pattern Definition: A Symmetrical Triangle forms during a prolonged consolidation period where both buyers and sellers compress volatility into an apex.
Because it followed a massive multi-year advance, it functions primarily as a bullish continuation pattern once resistance breaks.
Confirmation of Breakout: The Breakout Candle pushes above both the Descending Upper Boundary (~4.50%) and the previous cycle high (~5.20%),
confirming strong upward momentum rather than a False Breakout.
Macro & Market Implication: In bond markets, rising yields mean falling bond prices. A sustained breakout above multi-year highs signals tighter financial conditions, potential pressure on equity valuations, and higher borrowing costs across the economy.
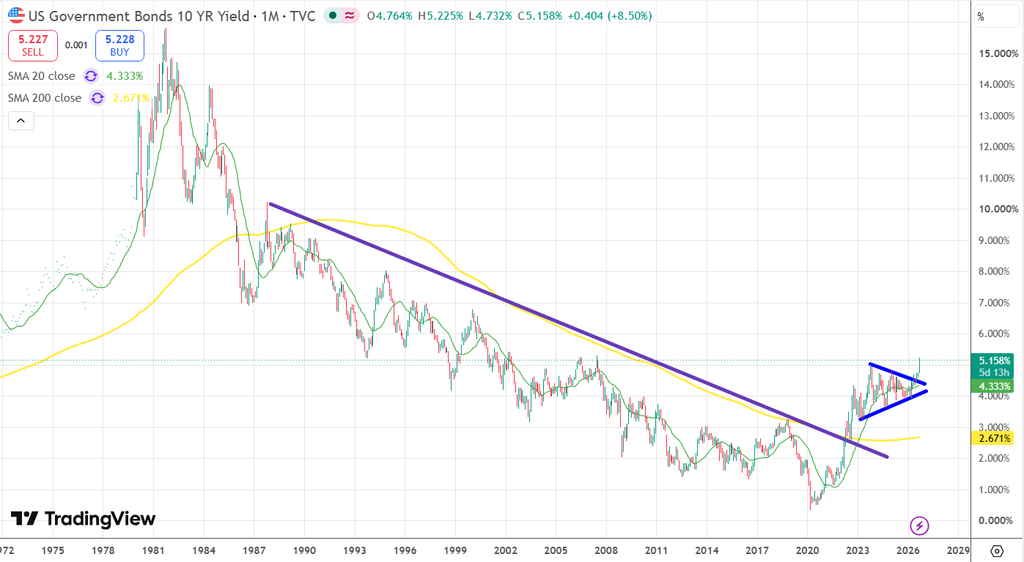
In May 2022, the 10-year yield broke cleanly above a 35-year descending trendline. From a technical analysis standpoint, this invalidation of long-term resistance confirmed a major structural reversal and paved the way for higher rate regimes.
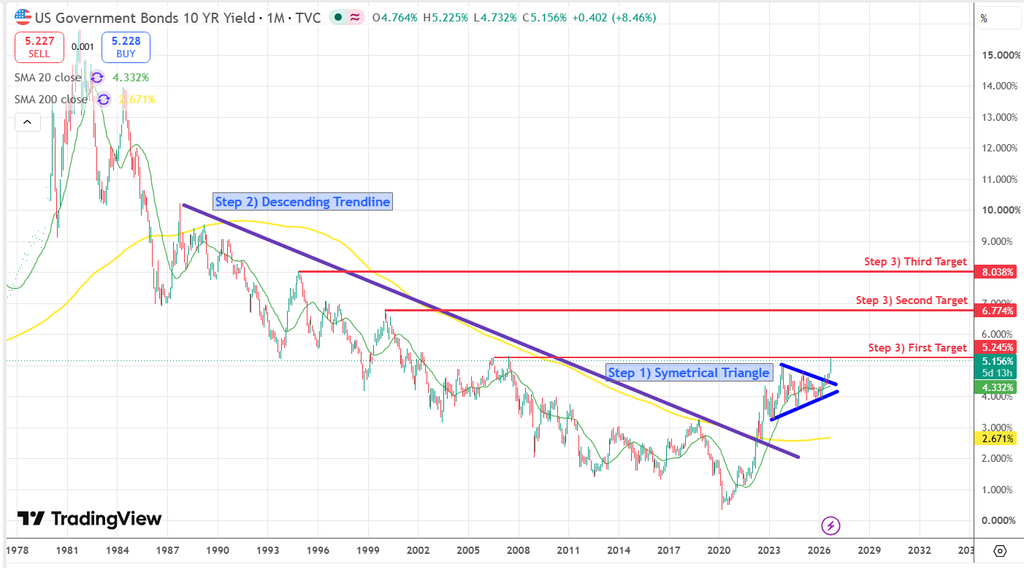
Upside Price Targets & Resistance Confluence:
Once a breakout from a multi-year consolidation confirms, technicians look to both historical pivot resistance and pattern-measured projections to establish realistic upside targets:
First Target (~5.25% – Immediate Apex Resistance): The initial milestone is the previous cycle peak set in October 2023. Testing ~5.25% represents the immediate hurdle; clearing and closing above this level on a monthly basis confirms the continuation out of the symmetrical triangle.
Second Target (~6.77% – The 2000 Macro Pivot): A sustained expansion above 5.25% opens the door toward 6.77%, which marks the cycle peak from May 2000. This zone also closely aligns
with the textbook measured move of the triangle (taking the vertical height of the triangle pattern, ~1.95%, and projecting it upward from the ~4.80% breakout pivot).
Third Target (~8.04% – Multi-Decade Resistance Ceiling): In an extended secular repricing scenario, the next major historical ceiling sits at 8.038%, matching the peak of the 1994 rate cycle. A progression toward this level would signify an aggressive macro regime shift, returning benchmark borrowing costs to levels not seen in over three decades.
Pullback Region & Structural Base (3.246%):
In technical analysis, every major consolidation pattern establishes a foundational floor that anchors the entire macro advance.
The Macro Swing Low: The 3.246% level marks the initial trough and base origin of the symmetrical triangle formed in early 2023.
Regime Shift Defense: This region represents the ultimate secular support floor. It sits directly above the broken 35-year descending trendline and comfortably above the monthly 200 SMA (~2.67%).
Trend Invalidation: While shallow corrections often find support near the apex boundaries (~4.33%–4.50%), any severe macro retracement that tests 3.246% serves as the line in the sand. As long as yields sustain above this structural base, the broader multi-decade expansion regime remains intact; a decisive monthly close below 3.246% would completely dismantle the triangle continuation thesis.
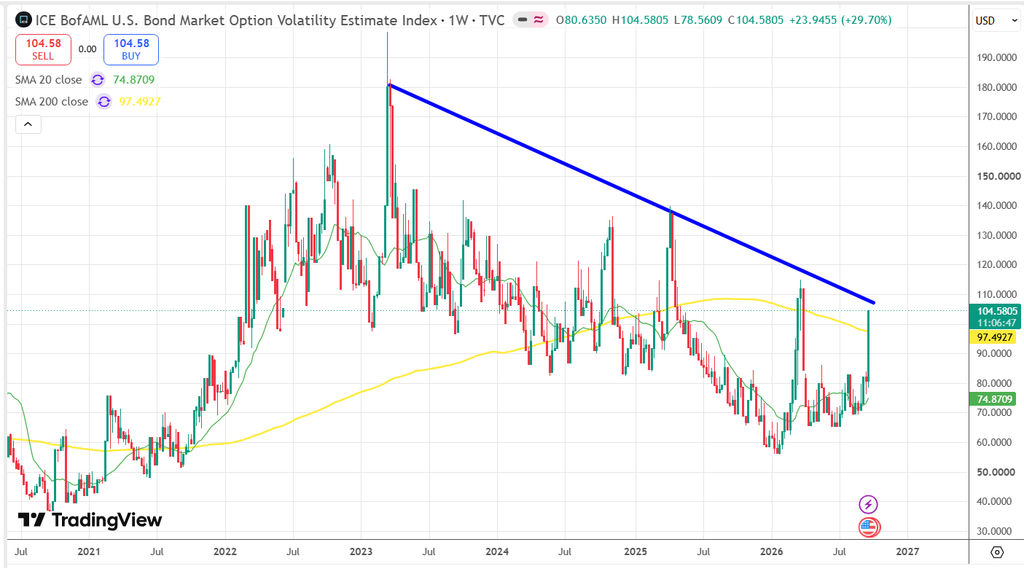
If MOVE gets ugly, US Bond Yields may get uglier.
Shortly, the definition of MOVE Index is the VIX of bonds.
Disclaimer: This post is for educational and informational purposes only and should not be considered as financial or investment advice. Trading financial markets involves a high level of risk, and you should always conduct your own research or consult with a professional advisor before making any investment decisions. Past performance is not indicative of future results.
Leave a Reply