
When executing technical strategies, analysing the alignment between multi-timeframe indicators and immediate price action is paramount for managing risk. This case study examines a recent technical setup in Cocoa Futures (COCOA.FUT), exploring the dynamics of trend transitions, indicator convergence, and structural invalidation points.
The Technical Setup and Market Context
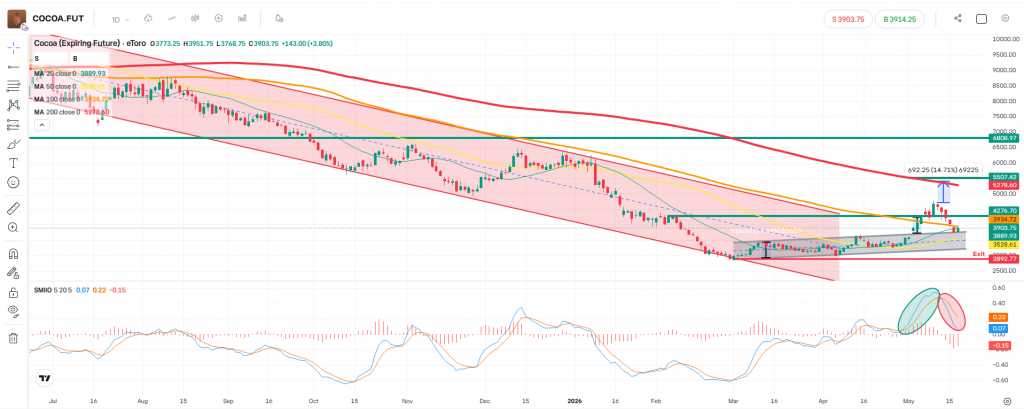
A technical entry was identified at the 4,680 level, a point where short-term momentum oscillators and price action initially converged to present a bullish configuration. Following the entry, the market experienced a corrective pullback, testing the discipline of the initial trade plan.
1. Structural Support and Channel Dynamics
Despite the immediate post-entry retracement, price action has found localised support. The market has pulled back to test the upper boundary of a previously broken descending regression channel, which is now overlapping with the lower bound of a nascent, slightly bullish ascending channel (shaded grey).
In technical analysis, former resistance frequently transitions into support. Keeping a close eye on whether this confluence holds is critical for evaluating whether the broader bearish trend is shifting to a neutral or bullish structural phase.
2. Moving Average Convergence and Resistance
From a conservative execution standpoint, initiating new exposure at current levels presents a lower-probability profile due to the lack of confirmation across major moving averages. Price action remains constrained by a heavy overhead technical stack:
- Daily Moving Averages (DMAs): The asset is currently trading below its 20, 50, 100, and 200 DMAs.
- The 200 DMA (Red Line): Sitting significantly higher, near the 5,278 mark, the 200 DMA underscores that the long-term primary trend remains technically bearish.
- Short-Term Cluster: The 20 and 50 DMAs are currently compressed near current price levels, serving as immediate dynamic resistance that bulls must reclaim to establish upside momentum.
3. Momentum Oscillators (SMIIO)
The SMIIO indicator at the bottom of the chart highlights a distinct shift in momentum. While a strong bullish cycle was registered in early May (indicated by the green ellipse), a bearish crossover has since triggered (indicated by the red ellipse), with the signal lines sloping downward. This warns that short-term sellers retain control of the immediate order flow, validating the decision to hold off on adding further exposure until a formal momentum reversal occurs.
Risk Management and the Invalidation Plan
A core pillar of professional trading is the strict adherence to a pre-defined invalidation level, independent of current market sentiment.
- The Invalidation Level (Exit): Formally established at 2,892.
- Rationale: This level lies entirely outside the current ascending support structure and below the major psychological floors established during the March-April consolidation phase.
Maintaining the position until this point allows the structural thesis room to breathe, while ensuring that if the structural support completely breaks, the risk is strictly capped. Accepting a planned invalidation is a standard, essential component of capital preservation.
⚠️ Regulatory Compliance & Educational Disclaimer
This analysis is provided solely for informational and educational purposes. It illustrates the application of technical analysis principles techniques and should not be construed as explicit investment advice, a recommendation, or an endorsement to buy, sell, or hold any financial instrument. Technical indicators are lagging measures and past performance is not a reliable indicator of future market results. Always ensure your risk management parameters align with your individual financial situation and regulatory framework.
Leave a Reply