

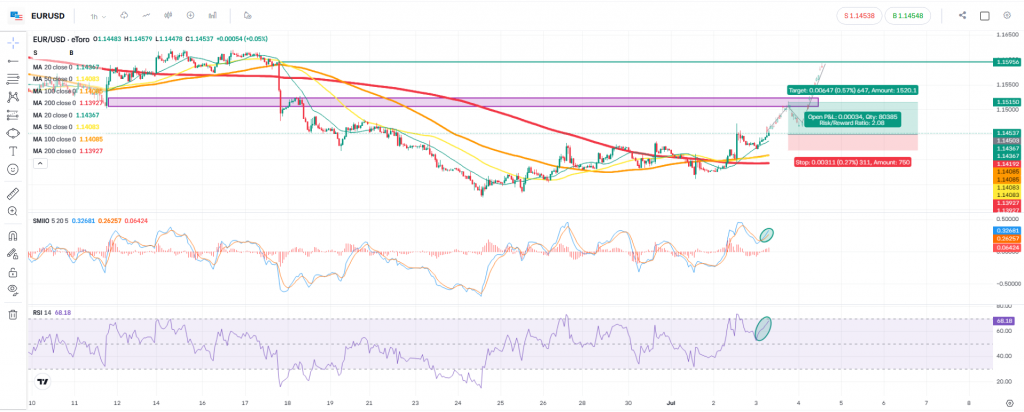
In this educational breakdown, we will examine the EURUSD hourly chart to demonstrate a core principle of technical analysis: how previous resistance levels can transform into support levels. Please refer to the accompanying chart, as we navigate the recent price action.
The Catalyst: NFP Release
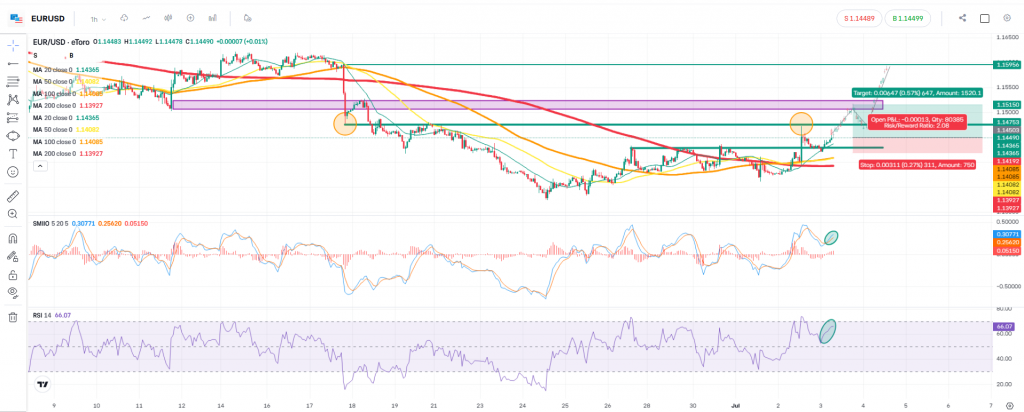
On 02/07/2026, the US Non-Farm Payrolls (NFP) report was released with figures coming in lower than expected. This macroeconomic catalyst drove a surge in the EURUSD pair, pushing the price straight up to 1.1475.
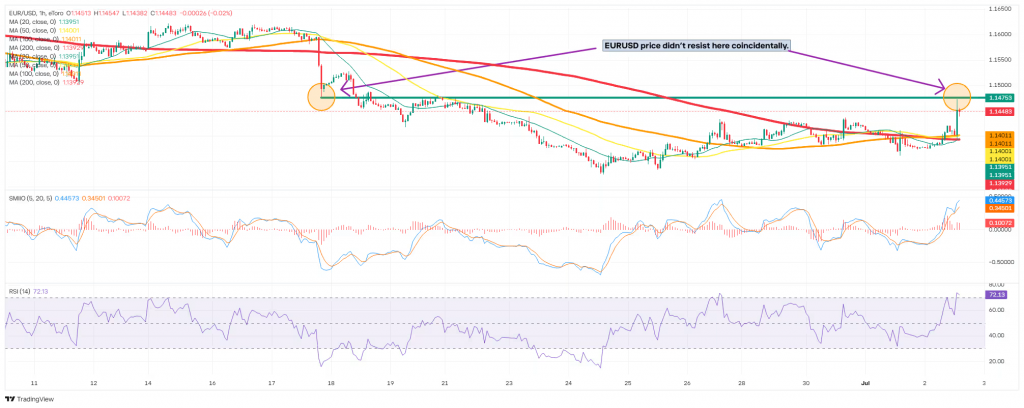
From a structural perspective, the 1.1475 level acting as resistance was not a coincidence. If we look back, this exact level represents the lowest price printed on 17 June 2026. This illustrates a key structural behaviour: historical price floors often become future price ceilings. The pressing question now is whether this dynamic will invert once again, turning 1.1475 into a new support level.
Role Reversal in Action: The 1.1429 Level
To understand why we might anticipate 1.1475 becoming support, we only need to look at recent history on this very same chart.
Prior to the NFP release, the 1.1429 level acted as a formidable ceiling. Price action touched this level three distinct times and faced strong resistance on each occasion. However, when the NFP data provided the necessary momentum on 02/07/2026, EURUSD broke forcefully through this resistance and surged to 1.1475.
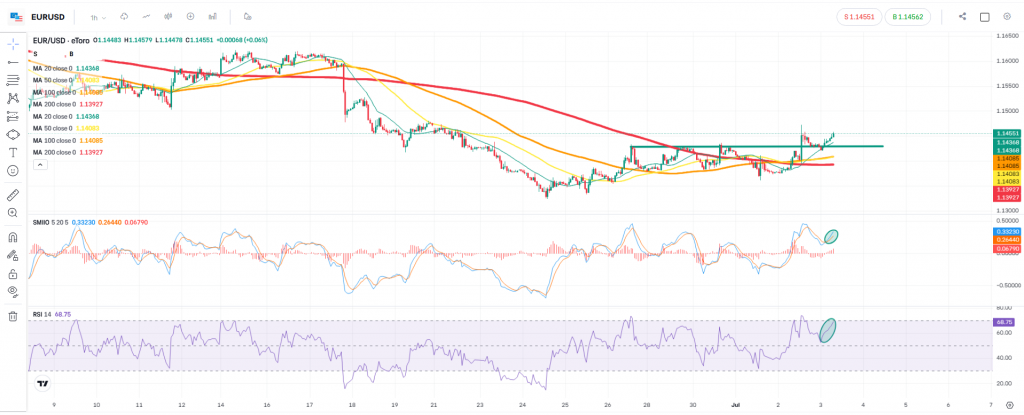
Following the initial surge, the momentum faded, resulting in a pullback from 1.1475. Crucially, the price retraced to the 1.1429 level. Instead of breaking back below, the price bounced. The old resistance level at 1.1429 has now clearly validated itself as a new support level.
Current Market Structure and Projection
Currently, the price has already bounced from the 1.1429 support and is trading around 1.1450.
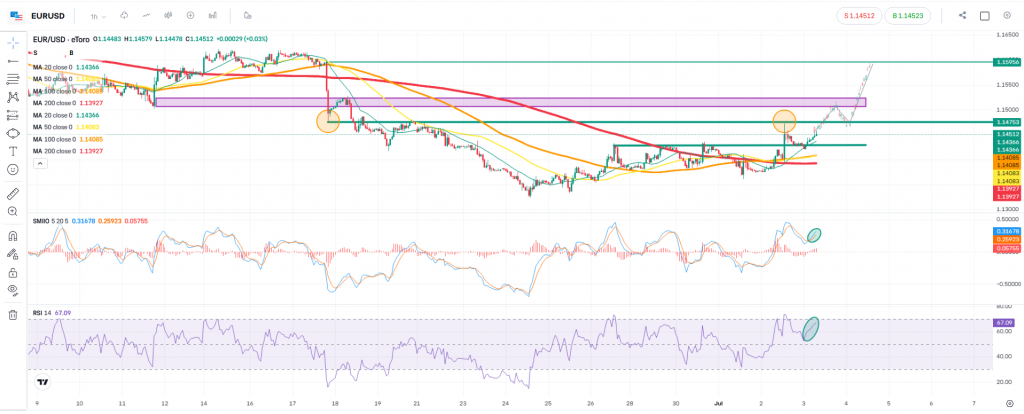
Drawing from the price action observed at 1.1429, we can form an educational hypothesis for the days or weeks ahead: the EURUSD price may break out above the 1.1475 resistance and head towards the previous higher support level of 1.1515. Furthermore, momentum indicators, specifically the SMIIO and RSI, are currently aligning to support this structural view.
Structuring the Trade and Risk Management
If a trader were to construct a hypothetical trading plan around this structure, the parameters would look like this:
- Target: 1.1515
- Stop Loss: 1.1420 (Placed slightly below the established 1.1429 support level to avoid getting caught by fake moves).
This framework provides a Risk/Reward ratio of 2.08.
Why is this ratio significant? In trading, you do not need to be right all the time. With a risk ratio of 2.08, even if the trading structure fails and you are allowed to be wrong 25% of the time, the statistical edge ensures that the portfolio remains profitable over the long term.
Risk management is a critical point at this stage. A solid analytical view requires strict architecture to protect capital. If you require further support and would like to draw a frame for your own risk management, review this resource: https://fxeqtrading.com/strategic-position-sizing-portfolio-scaling-framework/
Disclaimer: This post is for educational and informational purposes only and should not be considered as financial or investment advice. Trading financial markets involves a high level of risk, and you should always conduct your own research or consult with a professional advisor before making any investment decisions. Past performance is not indicative of future results.
Leave a Reply