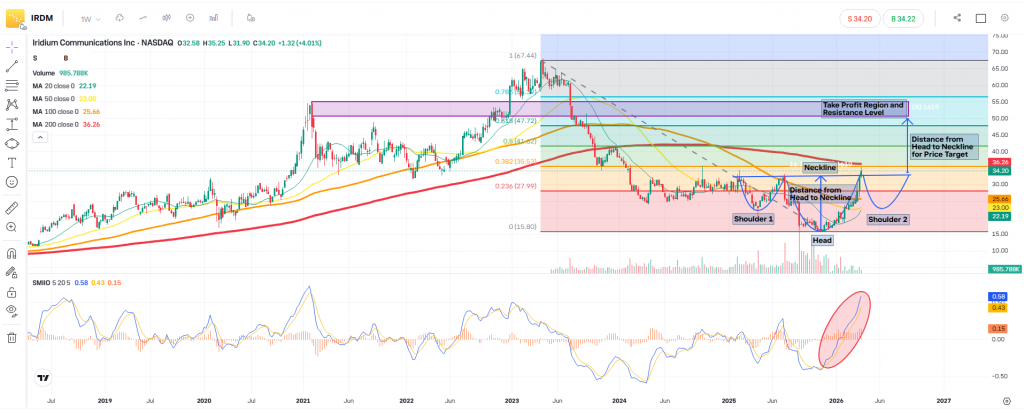
This is an educational piece where we share our approach to reading and interpreting price structure using the weekly chart of Iridium Communications Inc.
We focus purely on price action and market behaviour, rather than company fundamentals.
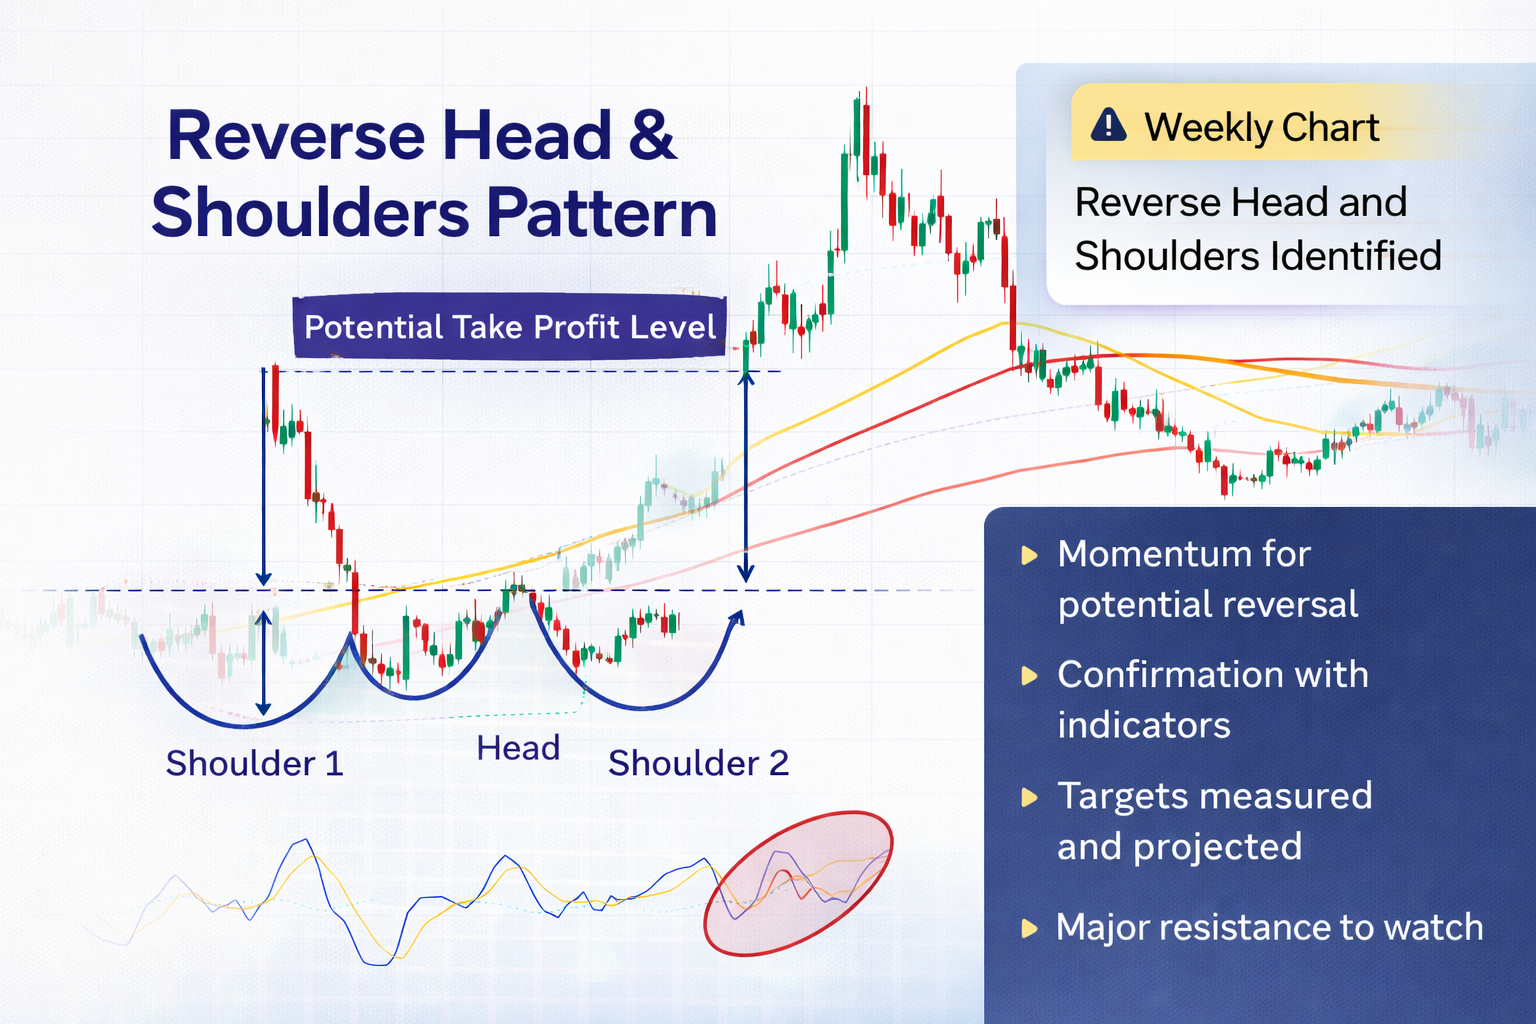
On the weekly timeframe, we can observe a reverse Head & Shoulders pattern, which is typically studied as a potential transition structure.
Our step-by-step approach:
- Shoulder 1:
The first low establishes initial downside exhaustion. - Head:
A deeper low forms, indicating a final push lower before potential stabilisation. - Shoulder 2:
A higher low compared to the head, suggesting selling pressure is weakening. - Neckline:
Drawn across the highs between the shoulders, acting as a key structural level.
Measuring the Potential Move
Once the structure is defined:
- We measure the distance from the head to the neckline
- Then we project this distance upward from the neckline
This gives us a potential target region, which in this case aligns with the 50 – 55 area.
Interestingly, this region also coincides with a previous higest zone from 2021, adding further structural confluence.
What We Are Monitoring Now
At this stage, we are not anticipating, but we are observing.
Key factors we are watching:
- 200 Weekly Moving Average:
Price is currently interacting with this level.
This often acts as a major dynamic resistance or support. - SMIIO Momentum Indicator:
We would like to see a clear shift in momentum (towards sell first) to validate any short-term downside move. - Moving Average Structure:
If price moves back below key moving averages, this may indicate weakness.
🔍 Scenario to Watch
If downside confirmation develops:
- Price could revisit the Shoulder 2 low, around the 23 region
From there:
- We wait again for full confirmation across structure and momentum
- Only then can a potential upside scenario towards the 50 – 55 region be considered structurally valid
Patience & Timing
This is a higher timeframe setup, and these structures take time to develop.
We may need to allow the market to evolve over the coming months, potentially towards September 2026, before a clearer directional outcome is confirmed.
Risk Management Comes First
The most important element is not prediction, it is risk management.
Position sizing, patience, and confirmation are what allow us to stay consistent in the market.
We focus on:
- Protecting capital
- Staying disciplined
- Waiting for the market to confirm our ideas
Final Thoughts
This structure provides a strong educational example of how we:
- Identify patterns
- Measure potential moves
- Combine structure with momentum
- Wait for confirmation before acting
Disclaimer
This content is provided for educational and informational purposes only and does not constitute investment advice or a recommendation to buy or sell any financial instrument. Markets involve risk, and past performance is not indicative of future results. Always manage your risk and position sizing accordingly.
Leave a Reply