From a broader perspective, the chart shows that Intel has transitioned from a prolonged downtrend into a recovery phase, now trading within a developing bullish channel.
1) Market Structure Shift
We can observe that the price has moved above key moving averages (20, 50, 100, and 200), which suggests a potential shift in long-term structure. This transition typically reflects improving sentiment and a possible change from distribution to accumulation.
2) Trend Development
The price action is currently respecting an ascending channel, where:
- The lower bound acts as dynamic support
- The upper bound represents potential resistance
This type of structure often indicates controlled upward momentum rather than aggressive breakout behaviour.
3) Momentum Confirmation
The SMI indicator is showing upward momentum, although the recent curvature suggests a possible short-term slowdown. This does not necessarily invalidate the trend, but it does highlight the importance of monitoring confirmation before assuming continuation.
4) Key Scenarios to Monitor
We are currently watching two possible developments:
Scenario 1 – Pullback Opportunity
- If the price retraces toward the lower part of the structure (around the mid-channel / previous support zone),
- And forms higher lows with supportive momentum,
- This may indicate continuation within the existing trend.
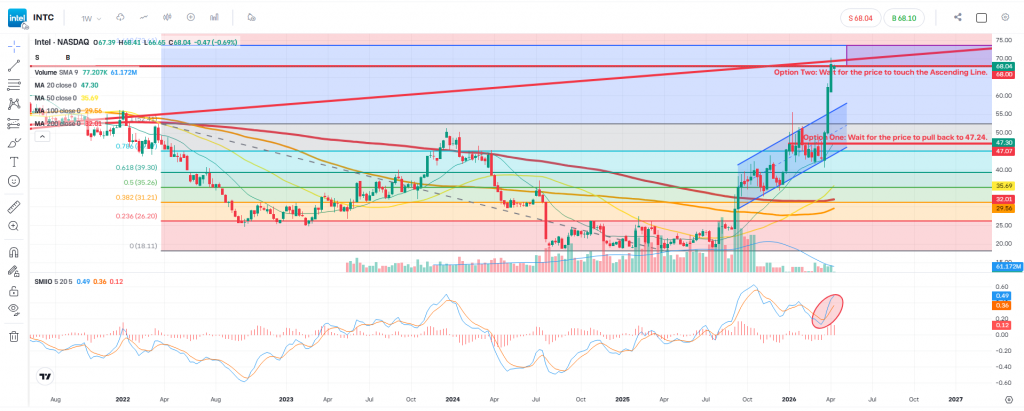
Scenario 2 – Extension Toward Resistance
- If the price continues higher without a meaningful pullback,
- The next area of interest would be the upper boundary of the ascending structure, which may act as resistance.
5) Key Consideration
While the structure is constructive, it is important to recognise that:
- Price is approaching historically significant resistance zones
- Momentum is slightly extended in the short term
This means confirmation is essential before assuming further upside.
6) Risk Awareness
As with any technical structure, not all setups play out as expected.
If the price fails to hold above key support zones or breaks the channel structure, it may indicate a shift in momentum or a return to consolidation.
Conclusion
At this stage, Intel appears to be in a controlled recovery trend, supported by improving structure and momentum. However, the next phase depends on whether the market:
- Confirms continuation through sustained higher highs, or
- Pulls back to establish stronger support before the next move
Patience and confirmation remain key when interpreting this type of setup.
Disclaimer
This analysis is provided for educational and informational purposes only and does not constitute investment advice or a recommendation to buy or sell any financial instrument. Financial markets involve risk, and individuals should conduct their own research and apply appropriate risk management.
Leave a Reply