

As technical traders, identifying structural confluence is one of the most reliable ways to build a high-probability trade thesis. Today, we are breaking down the daily chart of GE Vernova LLC (NASDAQ: GEV), which is presenting a classic “breakout and retest” setup within a highly structured macro trend.
Below, we dissect the channel dynamics, horizontal support structures, and momentum indicators to outline the key regions to watch.
1. Channel Dynamics & Macro Trend
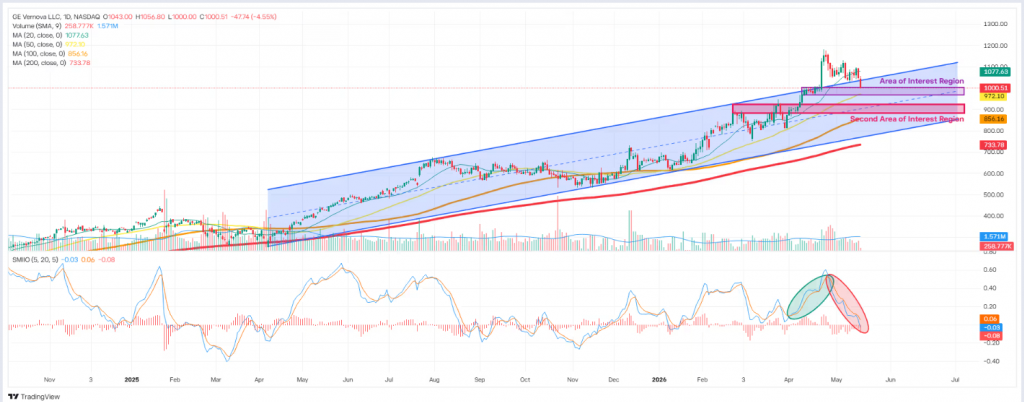
For over a year, GEV’s price action has been beautifully contained within a clear, ascending parallel channel (shaded blue). This persistent pattern highlights a strong, sustained macro uptrend.
- The Breakout: We recently witnessed an aggressive, high-momentum breakout above the upper channel boundary. This surge pushed the price into historic new highs, peaking near the $1,200 mark.
- The Retest: Following that parabolic peak, the price has naturally pulled back to cool off. It is currently testing the exterior boundary of that same upper channel line. In structural trading, broken resistance frequently flips to act as new support—making this the first critical structural test.
2. Key Horizontal Structural Zones
If the ascending channel boundary alone does not hold the price, we have two highly defined horizontal demand blocks acting as safety nets below:
| Support Level | Zone Range | Technical Significance |
| First Area of Interest | ~$1,000 | Purple zone; aligns perfectly with the upper channel line retest and a major psychological round number. |
| Second Area of Interest | ~$900 – $930 | Pink zone; represents the previous major structural resistance from April. |
Should the corrective pullback deepen, this Second Area of Interest represents a high-confluence flip zone. Not only is it validated by historical horizontal price action, but it also tightly aligns with the rising 50-day Simple Moving Average (the yellow line), making it an incredibly strong structural floor.
3. Momentum & Oscillator Confirmation
To complement the price structure, we look at the SMI (Stochastic Momentum Index) indicator at the bottom of the chart for momentum confirmation:
- The Green Circle: Highlights the strong bullish momentum acceleration that drove the initial aggressive breakout past the channel resistance.
- The Red Circle: Showcases the current corrective phase. The oscillator lines have crossed downward and are steadily cooling off from overbought territory. This indicates that the current downside is a healthy, expected correction rather than a structural trend reversal.
The Bottom Line
GE Vernova remains in a textbook bullish market structure. The current pullback offers a prime opportunity to observe how price reacts around major structural confluences. Whether support holds firmly at the $1,000 psychological level or requires a deeper correction to the $900–$930 confluence zone, patient traders will be watching these key structural footprints closely.
Comments & Community Notes:
- Keep a close eye on daily candle closes around the $1,000 mark. A definitive bounce here with expanding volume would confirm the channel breakout validation.
- Monitor the SMI for a bullish cross in the lower bands as an early signal that the corrective phase (red circle) is concluding.
Disclaimer: This post is for educational and informational purposes only and should not be considered as financial or investment advice. Trading financial markets involves a high level of risk, and you should always conduct your own research or consult with a professional advisor before making any investment decisions. Past performance is not indicative of future results.
Leave a Reply