From our perspective, this chart is currently at a decision point, and patience remains key before taking any directional exposure.
How We Read the Chart
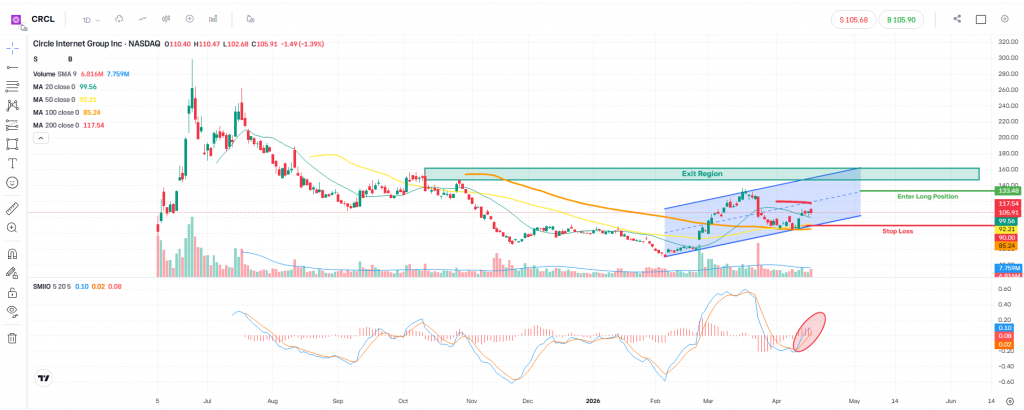
We are closely monitoring whether price can reclaim and hold above the 200-day moving average (200 DMA). This level will likely define whether the broader structure shifts into a more constructive phase.
For confirmation, we are not relying on a single breakout. Instead, we want to see:
- At least two consecutive daily closes above the 200 DMA
- Each candle closing higher than the previous one
This type of behaviour would suggest that momentum is building, rather than a false breakout.
Entry Consideration
If this structure is confirmed — alongside SMIIO strength and supportive volume — we would begin to consider long exposure.
- Our reference entry zone would be around 133, assuming price action reaches this level following confirmation.
Upside Structure
If the scenario develops as expected, the next area of interest becomes the upper boundary of the bullish channel, which we currently estimate to be in the:
- 150 – 160 range
This zone would act as a natural area to reassess positioning and manage exposure.
Risk Management
As always, structure comes first — but risk management comes before everything.
- If the setup fails and the structure breaks down, we would look to exit around the 90 level
- Position sizing remains critical, ensuring we retain flexibility to rebuild positions if conditions evolve
Final Thought
At this stage, this is not about predicting — it is about waiting for confirmation.
We let the market show its hand first, and then we react accordingly.
Disclaimer
This analysis is for educational and informational purposes only. It does not constitute investment advice or a recommendation to buy or sell any financial instrument. Always conduct your own research and ensure appropriate risk management.
Leave a Reply