This is an educational piece where we share our approach to reading and interpreting price action using structure, moving averages, and momentum indicators.
Market Context
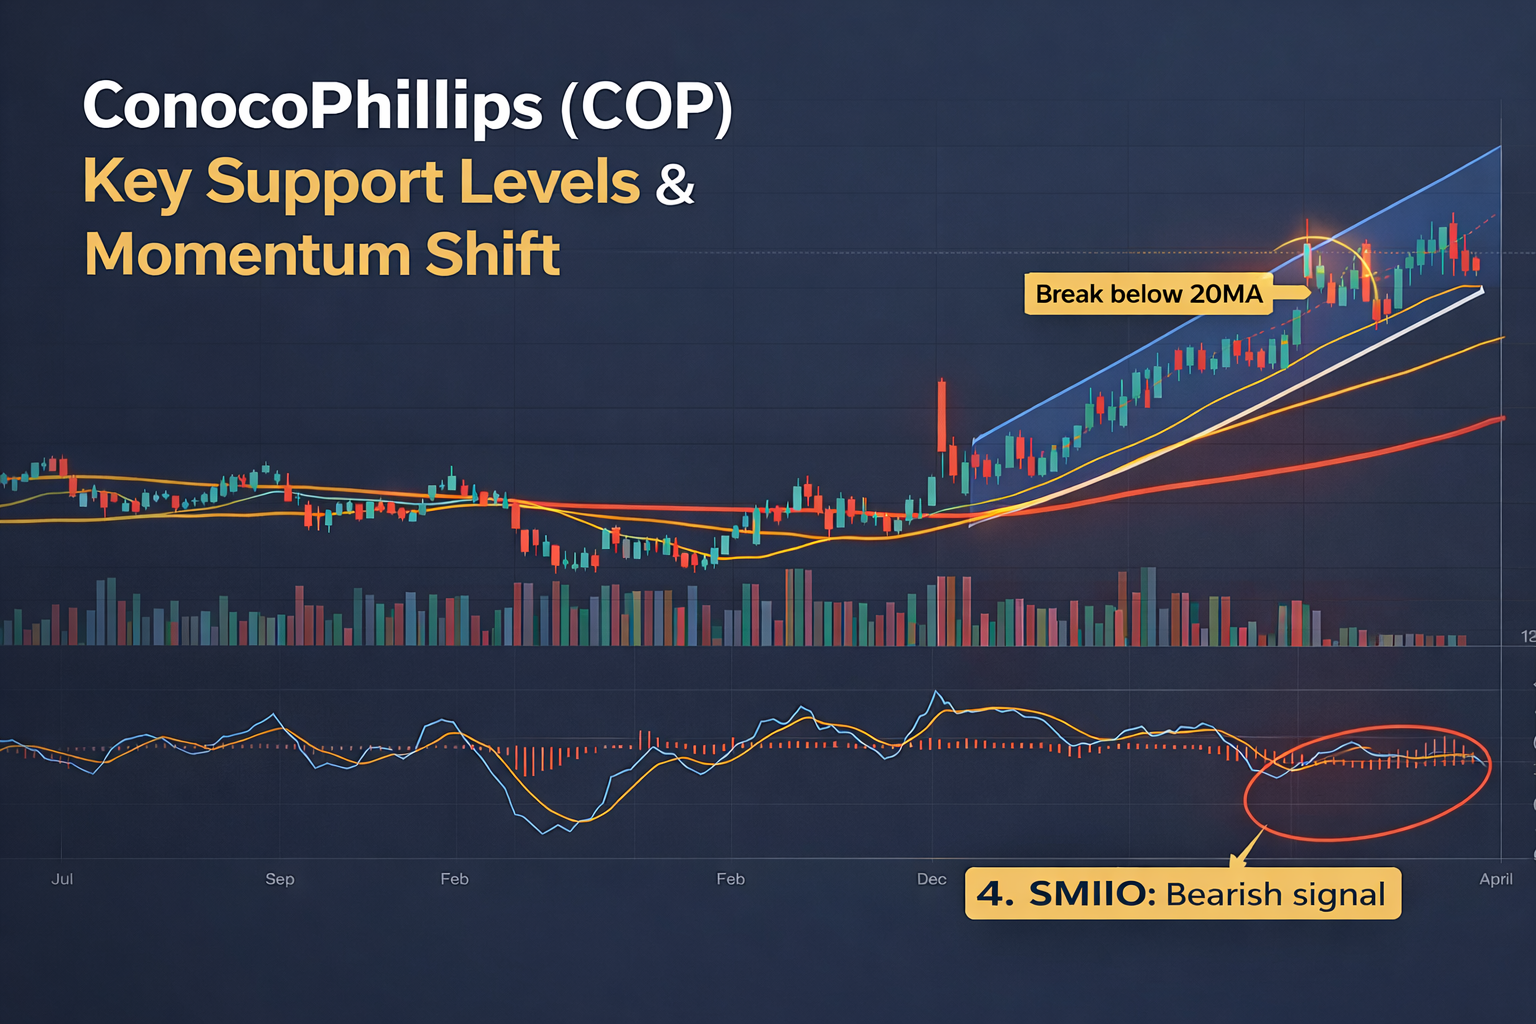
We are currently monitoring ConocoPhillips (COP) as price begins to show signs of a short-term structural shift following a strong bullish trend.
After moving within a well-defined ascending channel, price has started to lose momentum, prompting us to reassess the structure and identify potential downside levels.
What We Are Observing
1) Break Below the 20-Day Moving Average
One of the first signals we pay attention to is price relative to key moving averages.
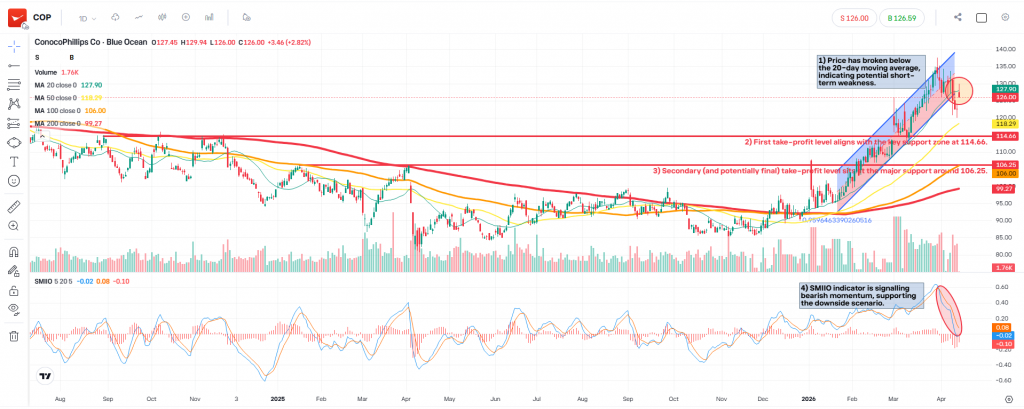
In this case, price has moved below the 20-day moving average, which often acts as a short-term trend guide.
This does not confirm a full trend reversal on its own, but it suggests weakening momentum and the possibility of a deeper pullback.
2) Momentum Confirmation – SMIIO
We also look at momentum indicators to validate what price action is telling us.
The SMIIO indicator is now showing a bearish signal, indicating that buying pressure is fading and sellers may be starting to take control.
When both:
- Price breaks key structure (like the 20MA), and
- Momentum confirms (SMIIO turning lower),
we begin to monitor downside scenarios more closely.
Key Levels to Watch
Rather than predicting direction, we focus on reaction levels.
➤ First Support – 114.66
This level represents a near-term support zone where price has previously reacted.
If price continues lower, this is the first area where we expect a potential pause or reaction.
➤ Secondary Support – 106.25
If downside momentum continues, the next key level sits at 106.25, which is a stronger structural support.
This could act as a deeper take-profit zone or final target area within the current corrective move.
How We Approach This
At FXEQ, we do not try to predict exact outcomes. Instead, we:
- Observe structure (trendlines, channels, support/resistance)
- Confirm with momentum (SMIIO)
- Define key levels for reaction (not prediction)
- Focus on execution and risk management
This approach allows us to stay flexible and react to the market rather than forcing a bias.
Key Takeaway
When:
- Price breaks below Bullish Channel and short-term structure (like the 20MA),
- Momentum indicators confirm weakness,
It often signals the beginning of a corrective phase, where the market may retrace towards key support levels.
Final Note
This analysis is not about being right or wrong. It’s about understanding how markets behave and preparing for different scenarios.
⚠️ Disclaimer
This content is provided for educational and informational purposes only and does not constitute investment advice, a recommendation, or an offer to buy or sell any financial instrument.
Markets involve risk, and past performance is not indicative of future results. Always ensure proper risk management and position sizing.
Leave a Reply