
Market Analysis | Technical Education
⚠️ Regulatory Disclaimer
The content of this article is for informational, educational, and analytical purposes only. It does not constitute financial advice, an investment recommendation, or an endorsement to buy or sell any security. Financial markets carry a high level of risk, and you may lose more than your initial investment. Past performance is not indicative of future results. Always conduct your own thorough research or consult with a regulated financial advisor before making investment decisions.
The Current Technical Setup
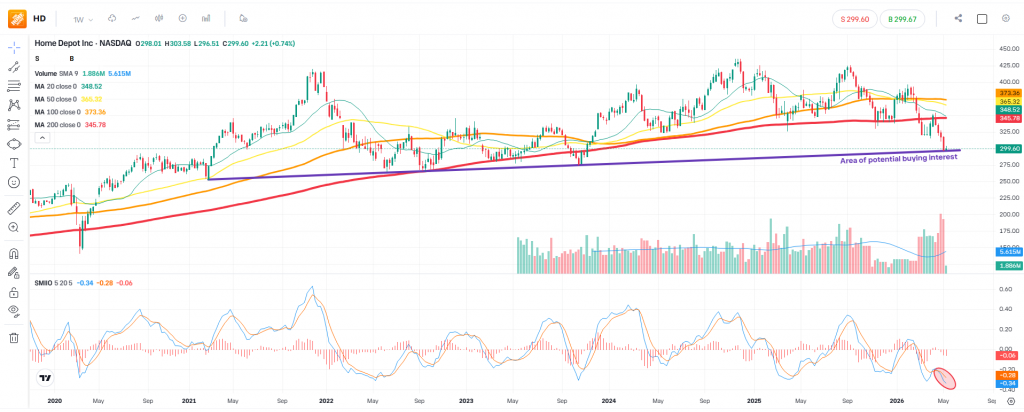
A look at the weekly chart for Home Depot Inc. shows a market currently dominated by short-term sellers. Following a sharp pullback from its recent highs, major short-term moving averages and trend indicators are currently pointing downward.
However, from a macro perspective, the price action has reached a critical structural juncture that warrants close attention.
Key Levels and Indicators to Watch:
- The Ascending Trendline: The price is currently testing a well-defined, multi-year ascending trendline. This zone, historically tracking between $296 and $300, has structurally acted as an area of potential buying interest in the past.
- Oversold Momentum: The SMI Ergodic Oscillator (SMIIO) at the bottom of the chart is sitting deep within oversold territory. While an oversold reading is not an automatic buy signal, it historically indicates that the immediate downward momentum may be overextended, often preceding a consolidation phase or a technical relief bounce.
Strategy: Tracking Market Confirmation Over Anticipation
In disciplined technical analysis, identifying a support zone is only the first step. Entering a market prematurely at a support line is often referred to as “catching a falling knife.” Because the immediate trend remains bearish, a systematic approach requires waiting for the market to validate the level.
Rather than guessing a market bottom, an objective monitoring strategy looks for specific confirmations:
- Price Stabilisation: Observing whether daily and weekly candle structures begin to flatten out, showing a deceleration of selling volume and the appearance of bullish rejection wicks near the $296–$300 zone.
- Indicator Crossovers: Waiting for an objective shift in momentum, such as a bullish crossover on the SMIEO or a break above short-term micro-trendlines on lower timeframes.
Conclusion
Home Depot is sitting at a major technical crossroads. The structural support is undeniable, but the prevailing momentum is downward. By prioritizing market confirmation over predictive guesswork, traders and analysts can let the market reveal its next intended direction before taking action.
Leave a Reply