
Category: Uncategorized
-
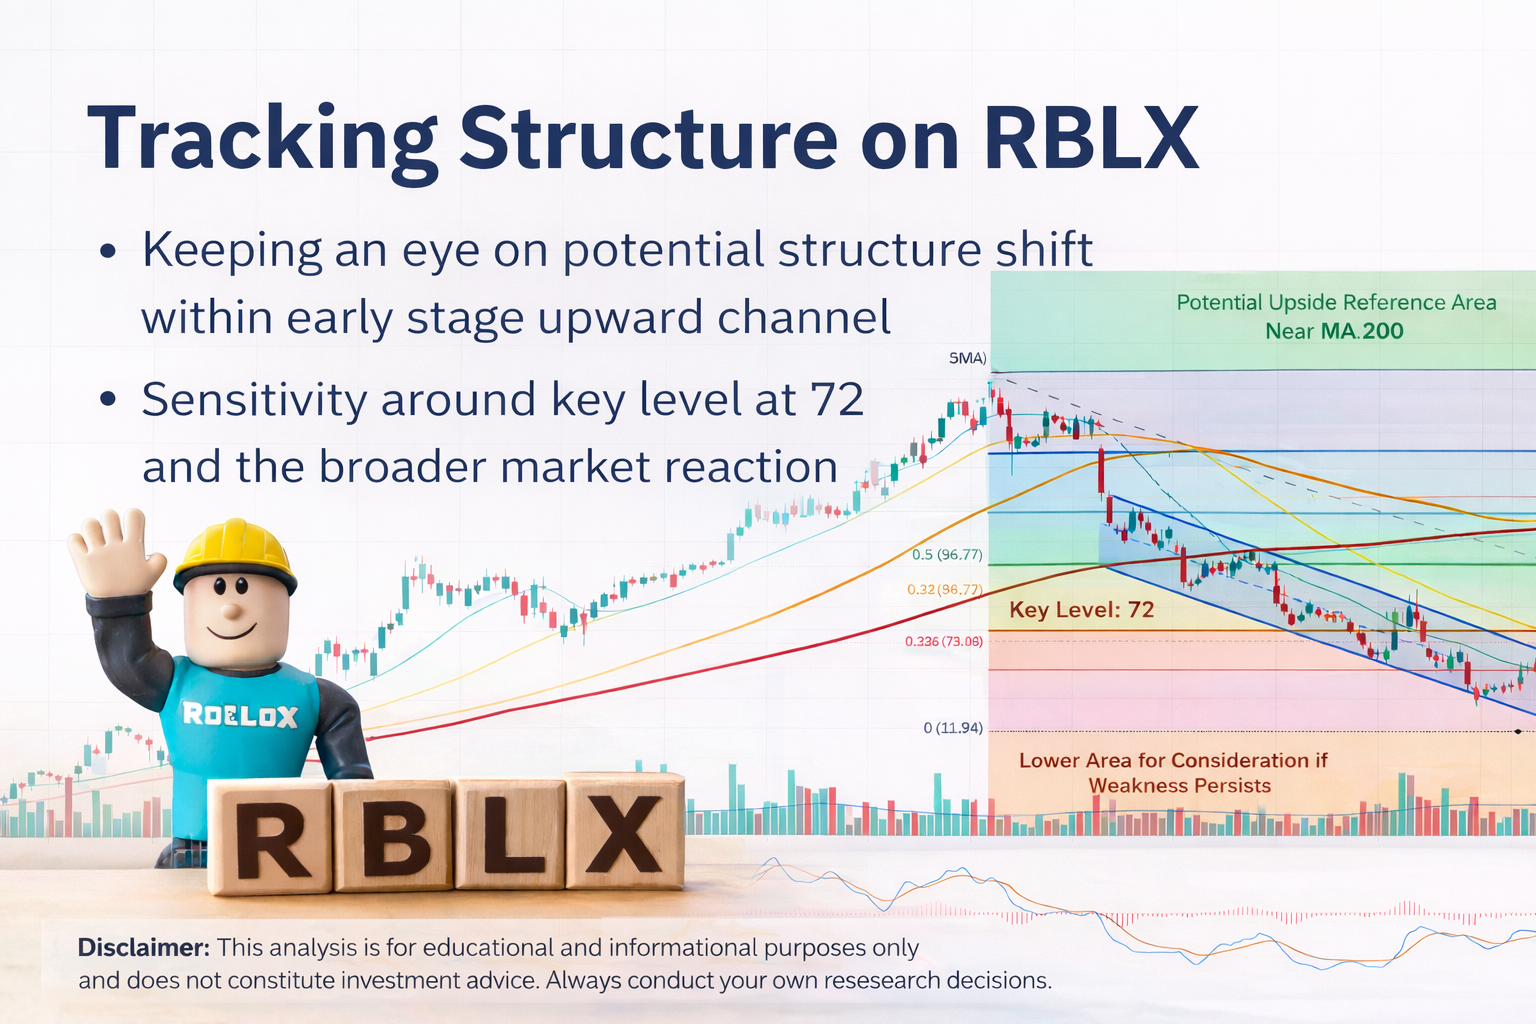
Market Overview We are currently observing a possible transition in market structure on RBLX. After trading within a bearish channel, price action is attempting to move higher, forming what may evolve into a short-term bullish channel. At this stage, this remains an early development rather than a confirmed shift. Key Level in Focus: 72 The…
-
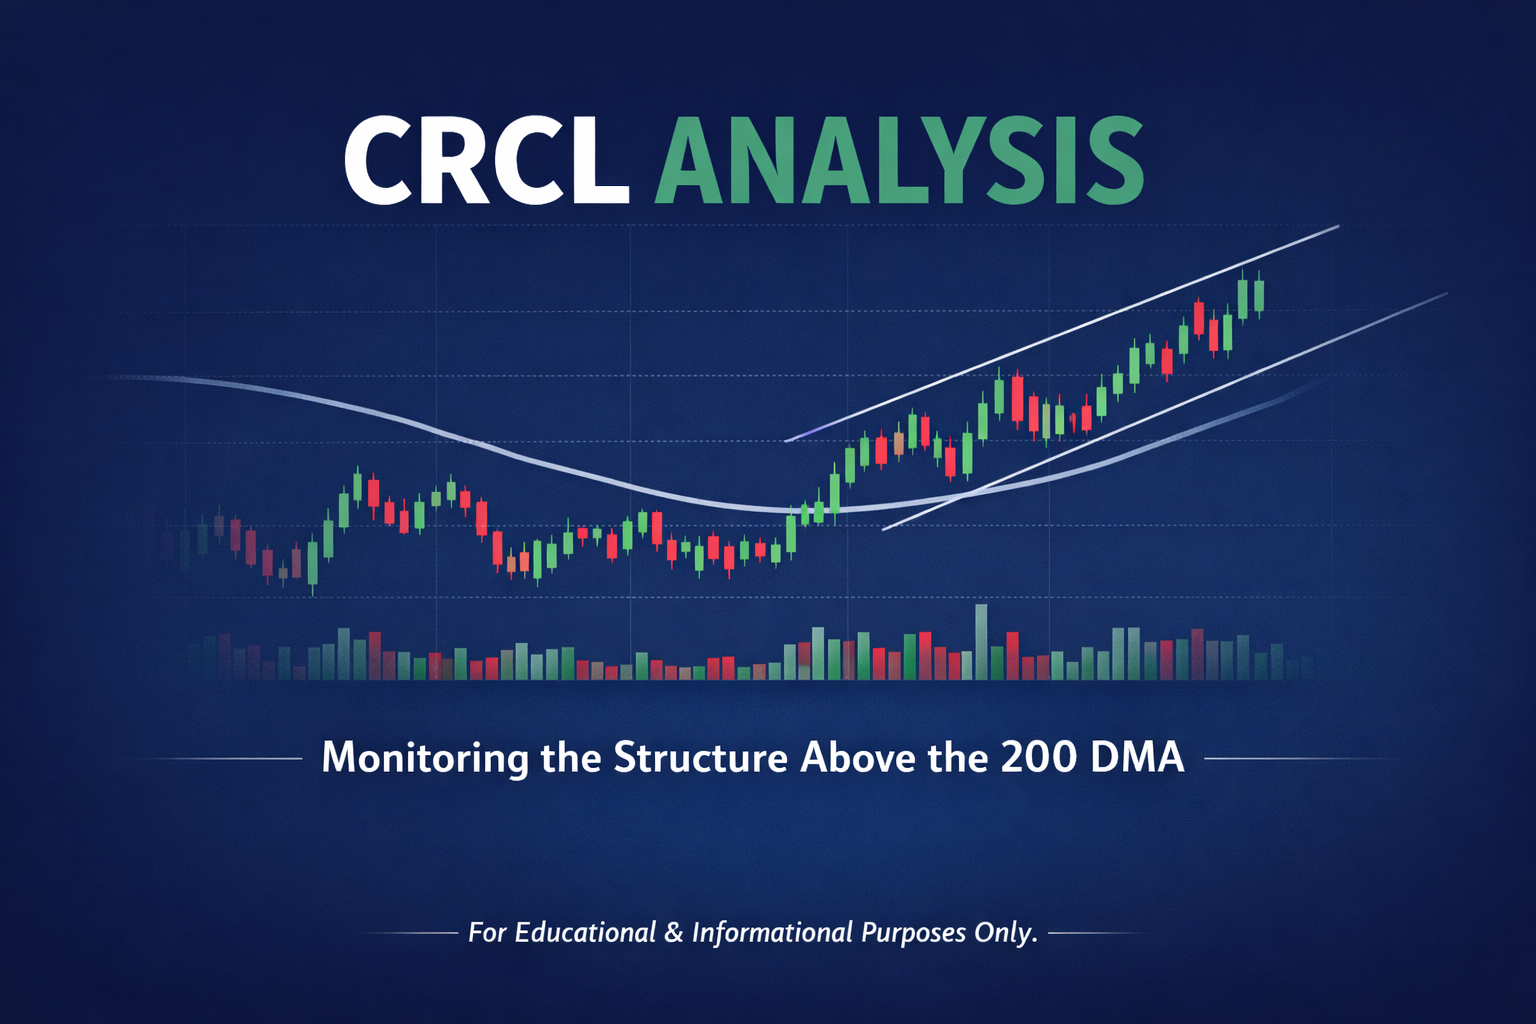
From our perspective, this chart is currently at a decision point, and patience remains key before taking any directional exposure. How We Read the Chart We are closely monitoring whether price can reclaim and hold above the 200-day moving average (200 DMA). This level will likely define whether the broader structure shifts into a more…
-

From a structural perspective, the chart is currently forming a symmetrical triangle, which typically represents a period of consolidation before a potential expansion in volatility. However, when we look deeper into the price action, we can see that the structure is leaning slightly towards the bullish side. What supports the bullish bias? What are we…
-

Market Structure The chart shows that LUNR is currently trading within a well-defined bullish channel, with price consistently respecting both the lower and upper bounds. This type of structure typically reflects controlled upside momentum rather than an aggressive breakout phase. More recently, price has accelerated towards the upper half of the channel, suggesting increasing buying…
-

From a structural perspective, RKLB remains within a broader bullish channel, indicating that the overall trend is still constructive. Within this channel, the midline has historically acted as a support level, helping price maintain its upward trajectory. However, more recently, this same level has started to behave as a resistance zone, which makes the current…
-
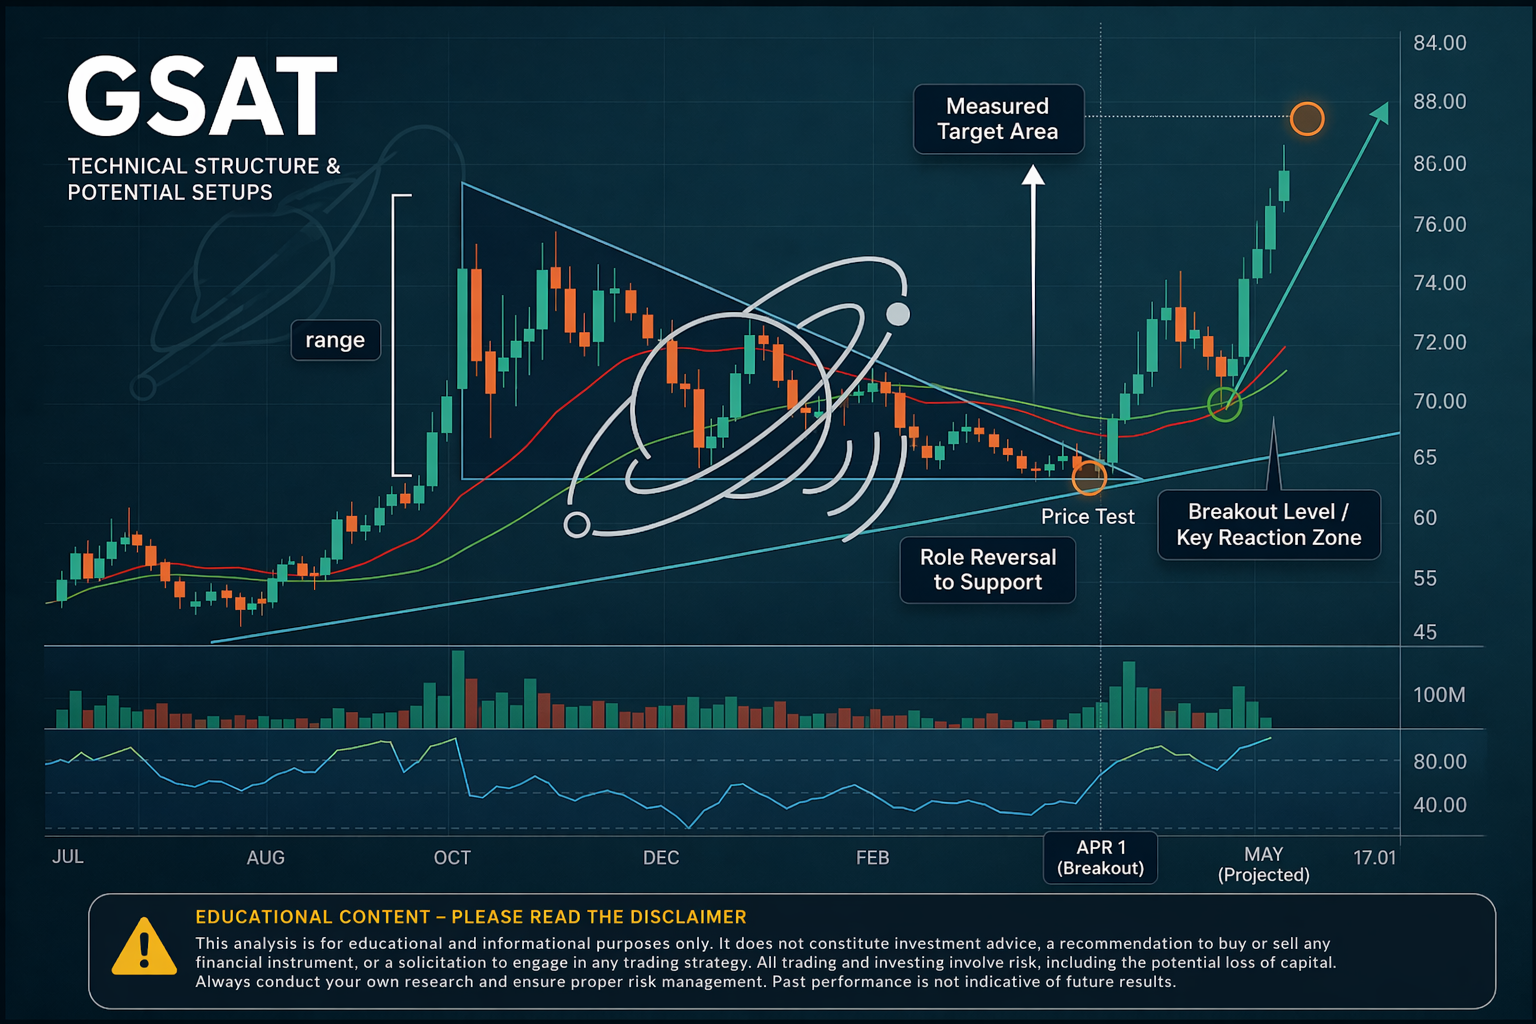
When we look at the recent price action in GSAT, the structure provides a clear example of how classical chart patterns can guide expectations — but more importantly, how we manage risk around them. 1. Descending Triangle & Breakout Confirmation From late 2025 into early 2026, price formed a descending triangle, characterised by: On 1st…
-
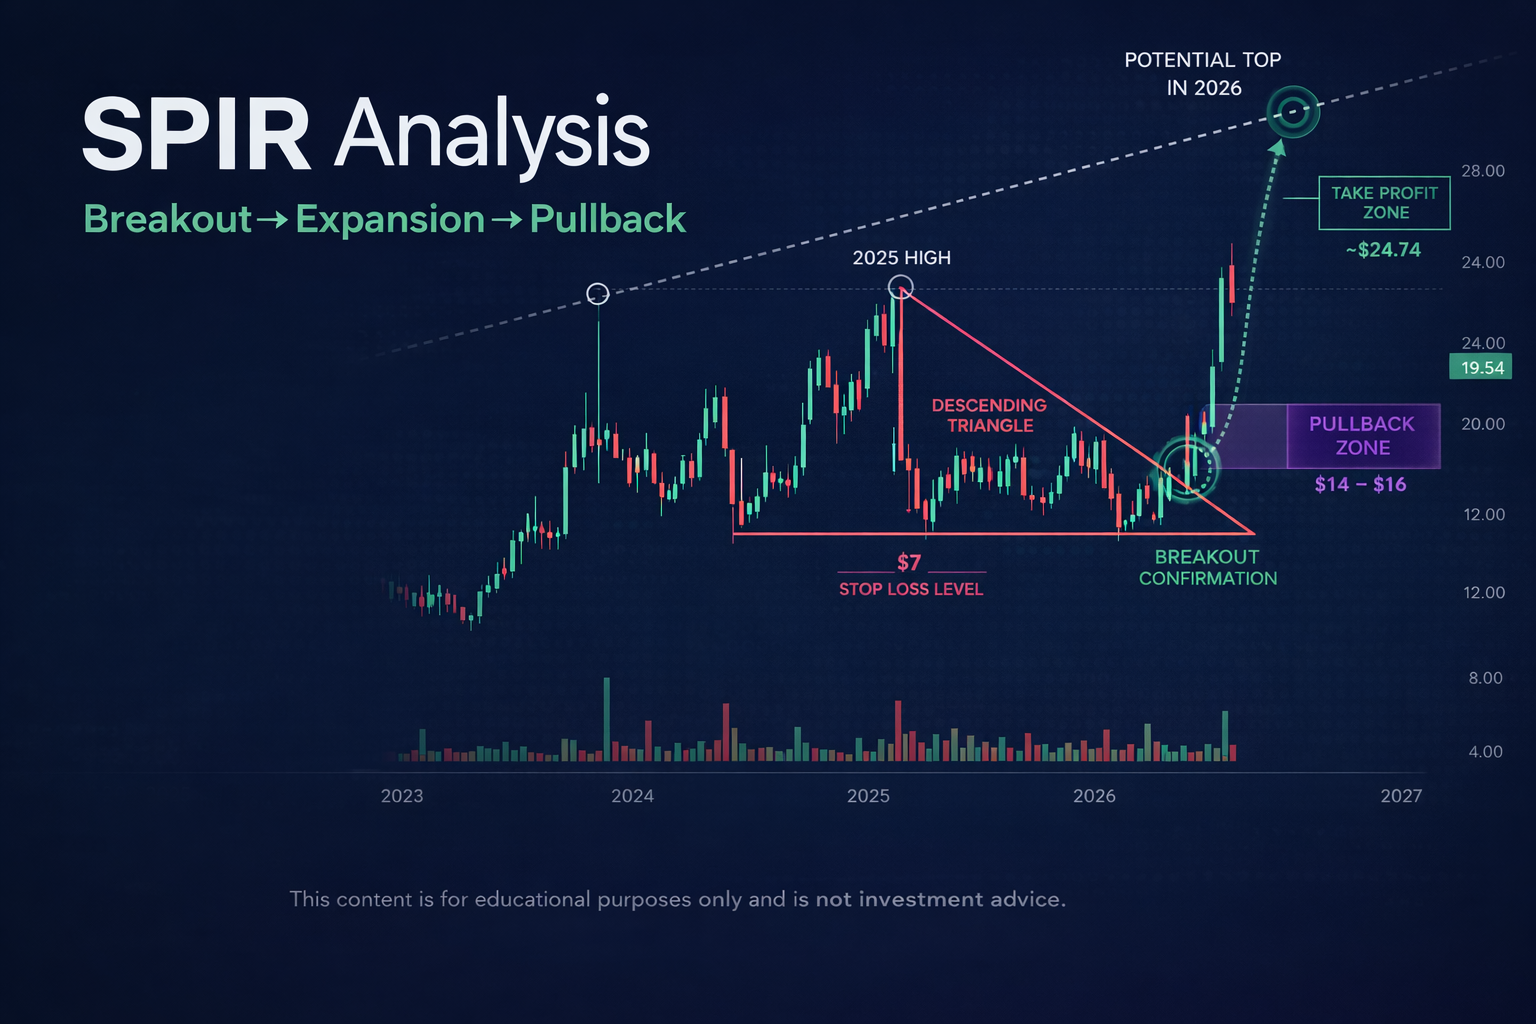
1) Timeframe Context This analysis is based on the weekly chart, which allows us to focus on the broader structure rather than short-term noise. 2) Identifying the Parabolic Structure We initially observed a parabolic move developing, which naturally raises the question: Where could the potential top form? To approach this: This gave us a projected…
-
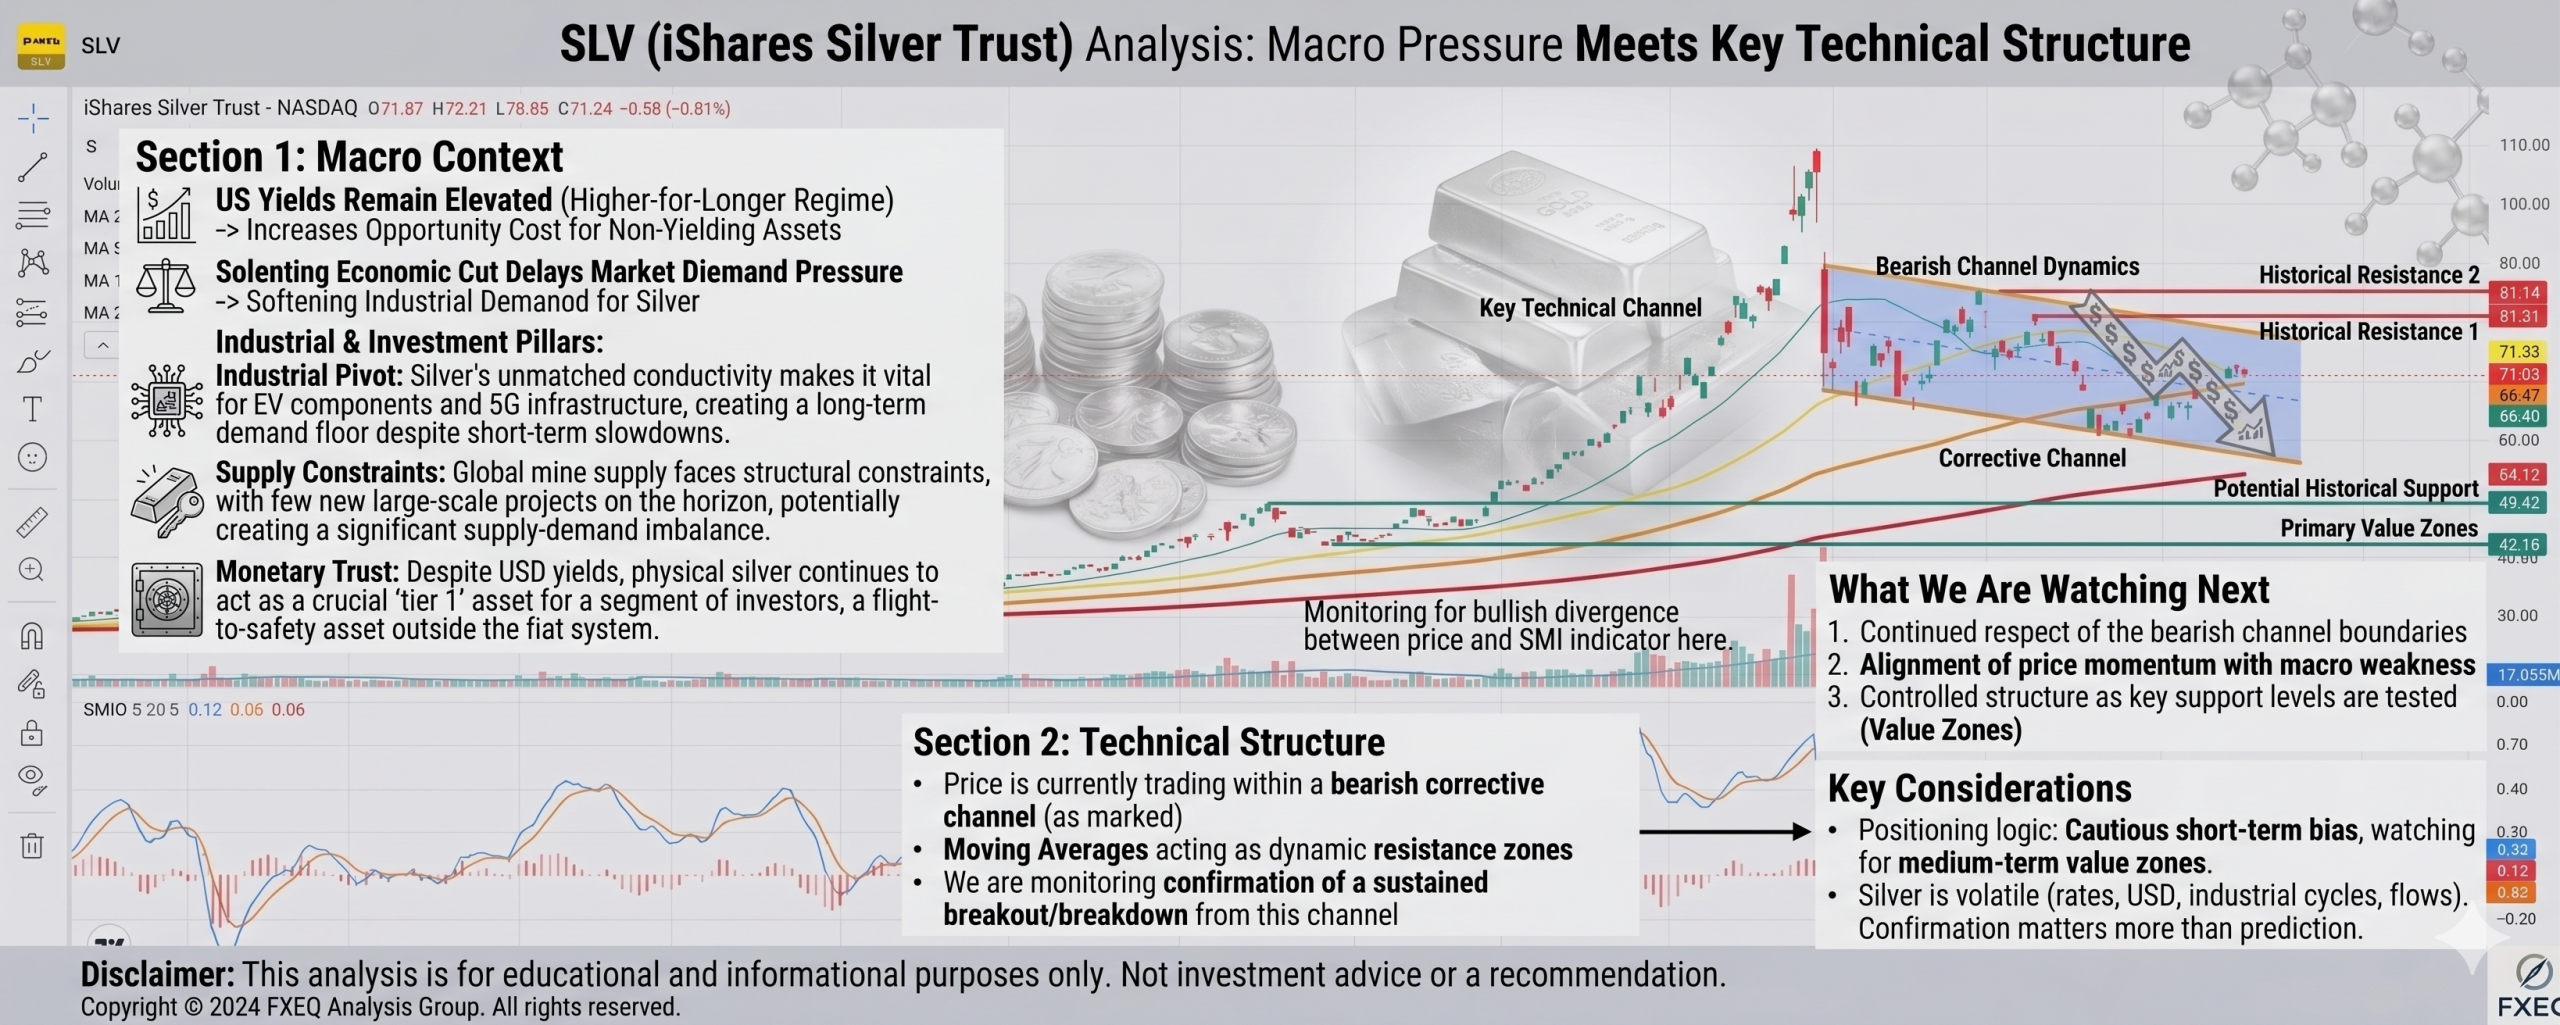
Macro Context – Why Silver Is Under Pressure From a macro perspective, the current environment is not particularly supportive for silver. At the same time, tighter financial conditions are starting to feed into the real economy: This creates a double pressure effect on silver: That combination is important, because it suggests silver is not just…
-

Market Structure Overview From a higher timeframe perspective, Capital One Financial Corp (COF) continues to trade within a well-defined weekly bullish channel, maintaining a broader upward structure. More recently, price has rotated back toward the lower bound of this channel, an area that has historically acted as a dynamic support zone. Recent Price Behaviour At…
-

Market Context: From Underperformance to Recovery Iridium Communications has transitioned from a prolonged corrective phase into a strong recovery structure. After an extended downtrend, price action began stabilising and gradually formed a rounded base, a classic transition from distribution to accumulation. What makes this structure particularly interesting is the shift in behaviour: This suggests that…