Category: Uncategorized
-
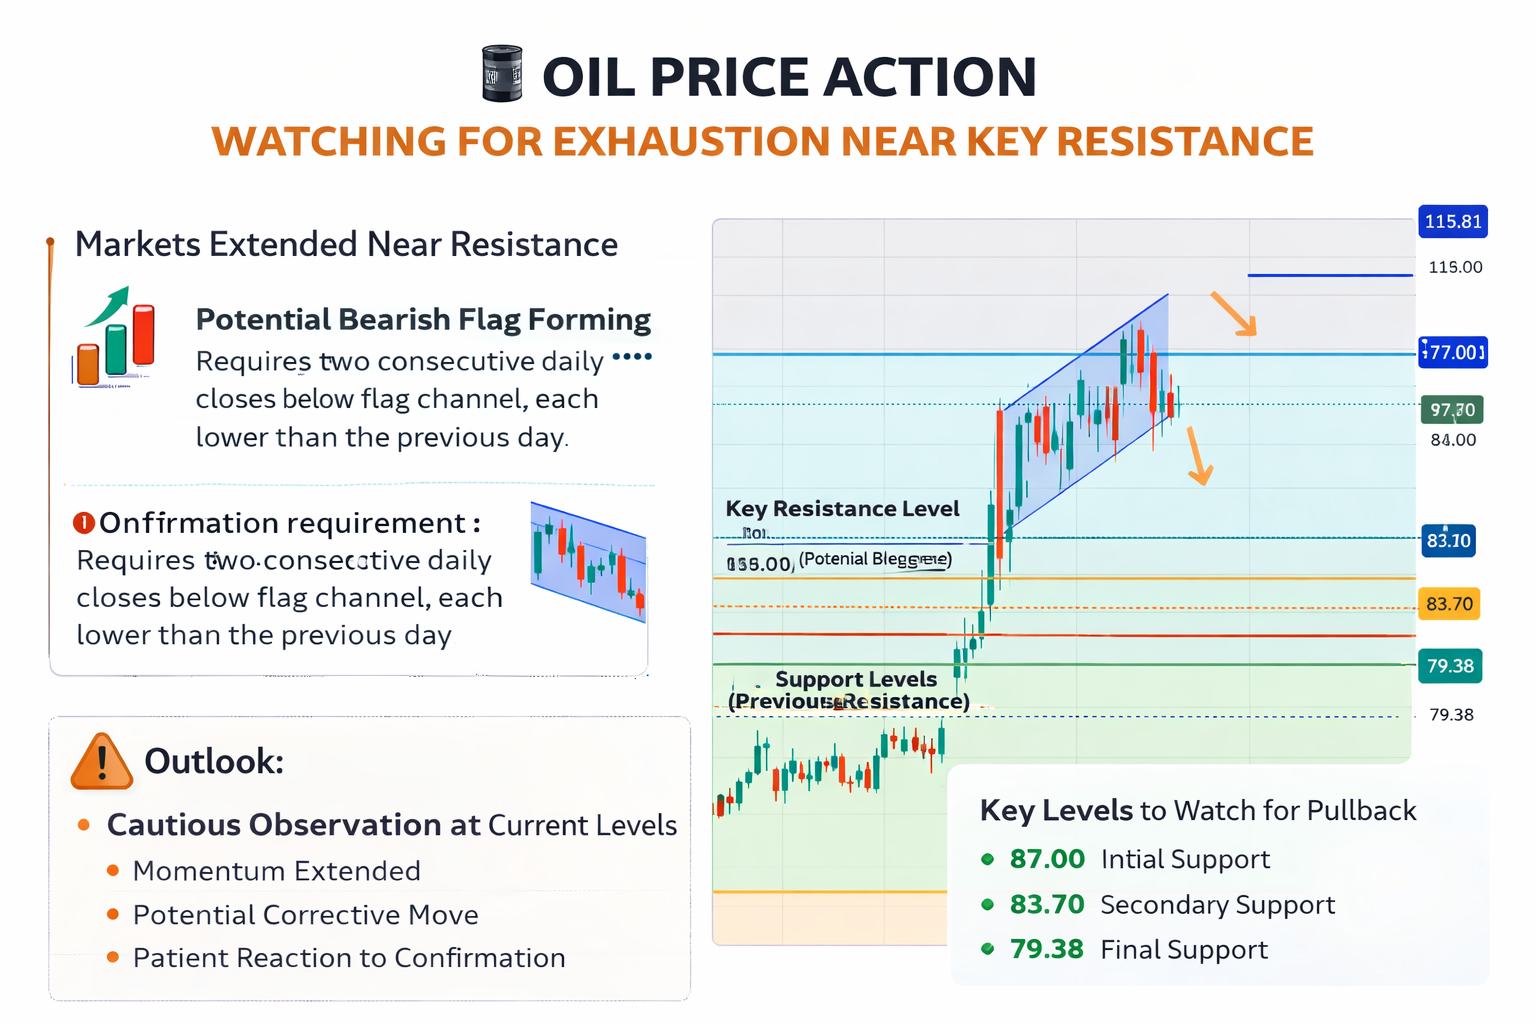
Market Overview We’re currently observing a strong impulsive move in Oil, with price maintaining bullish momentum over recent sessions. However, as traders, our focus is not on prediction, but on structure, confirmation, and disciplined execution. At this stage, price is approaching a key resistance zone near 115.81, which historically represents a significant level where supply…
-
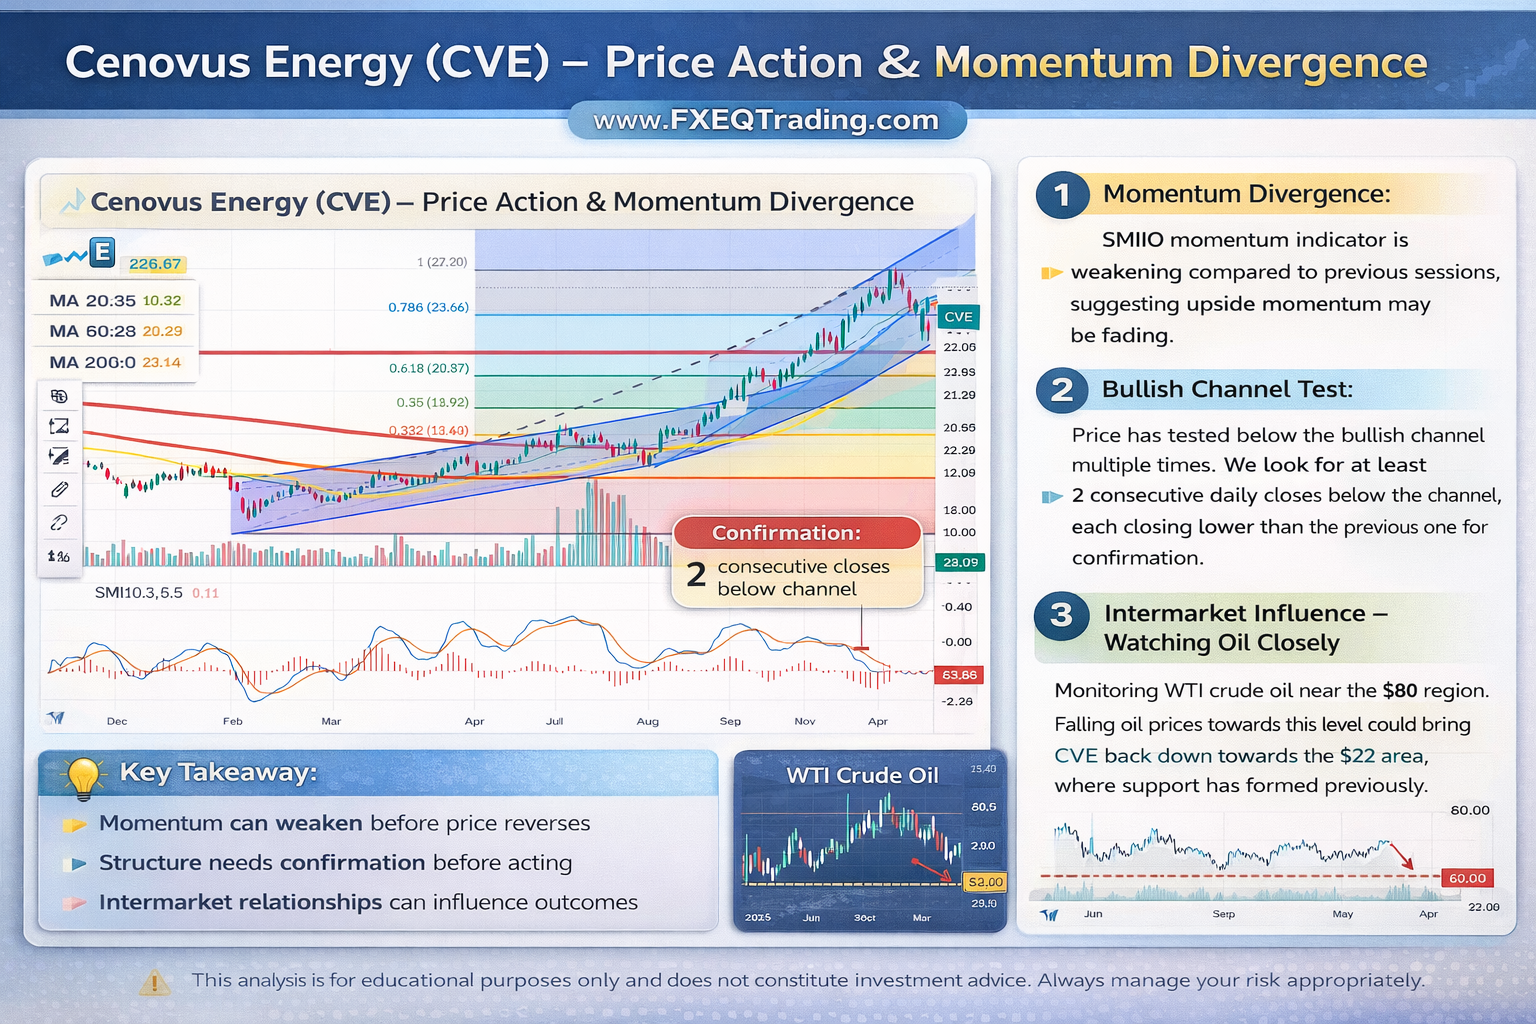
This is an educational piece where we share our approach to reading and interpreting price action, using Cenovus Energy Inc (CVE) as a current example. We focus purely on structure, momentum, and intermarket relationships rather than company fundamentals. What We Are Observing There are a few key developments on the chart that are worth highlighting…
-
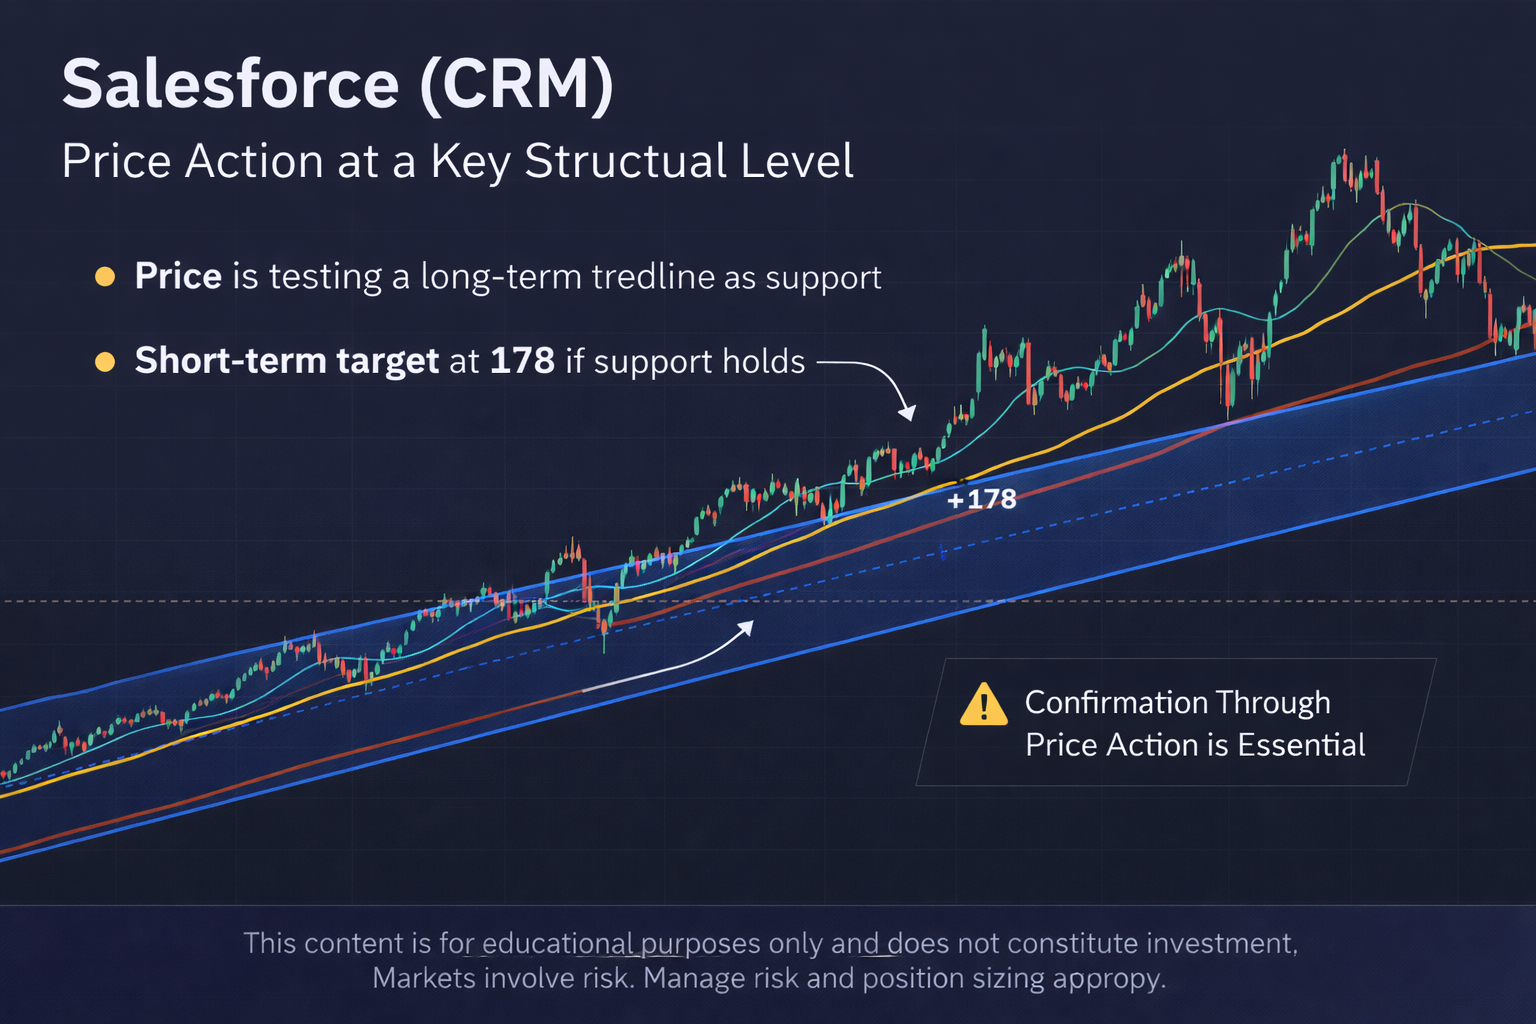
At FXEQ Trading, we focus purely on price action, rather than company fundamentals. Our goal is to understand how price behaves around key levels and allow the market to guide our decisions. Current Market Structure Looking at the weekly chart, price is currently sitting right on a long-term ascending trendline. This trendline has historically acted…
-
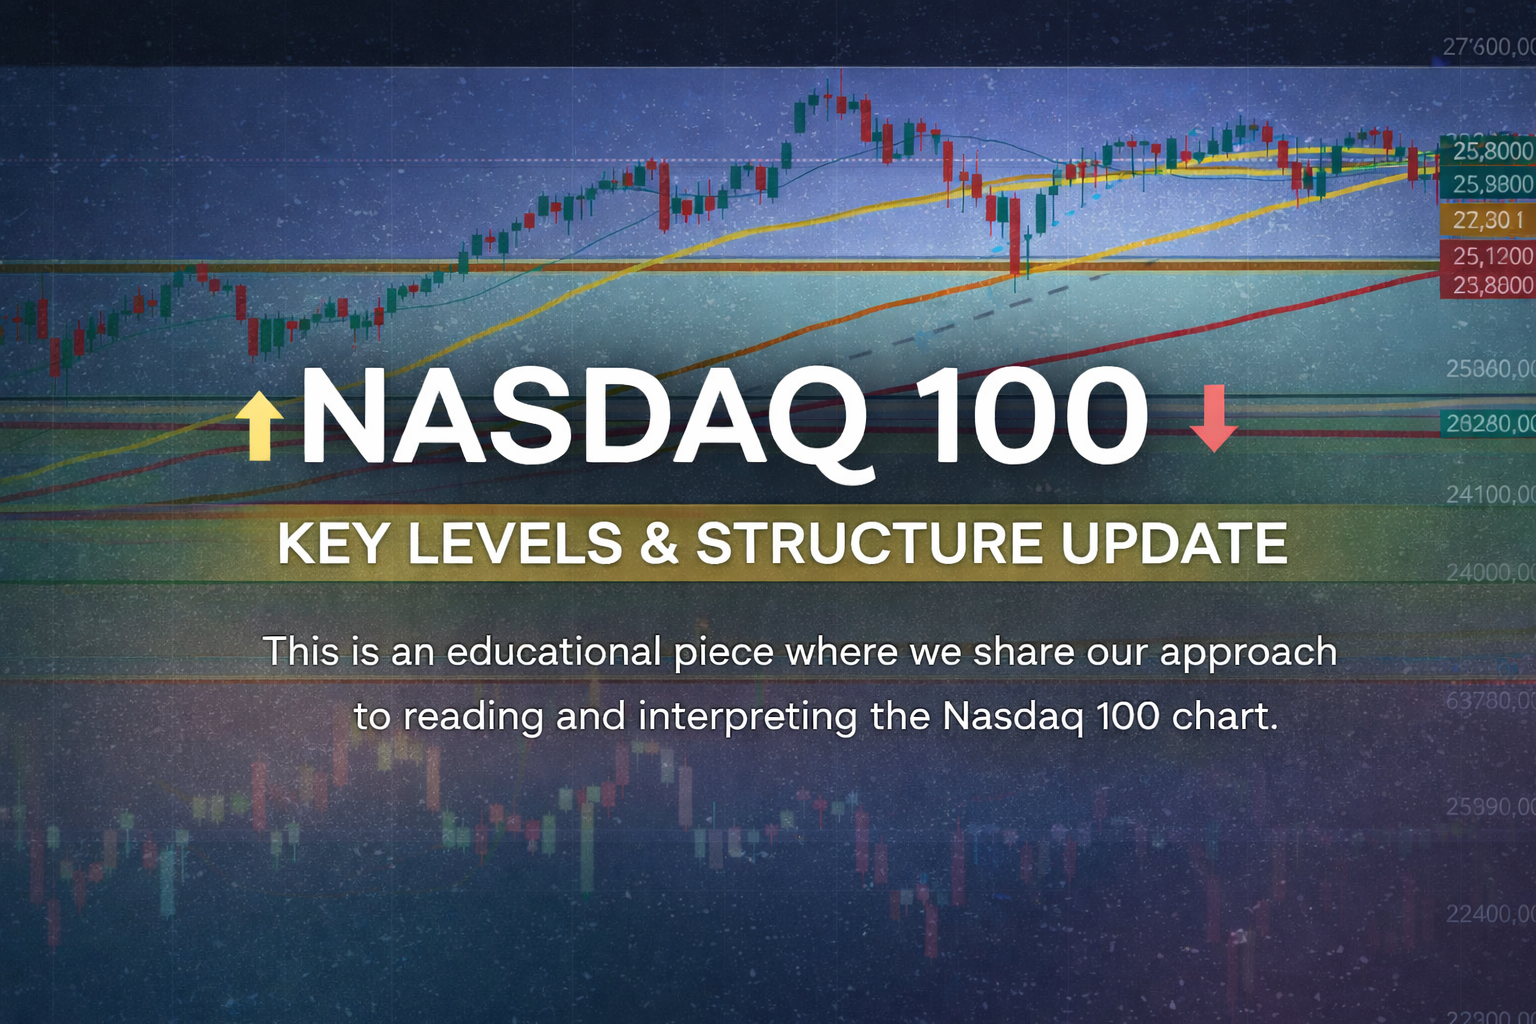
This is an educational piece where we share our approach to reading and interpreting the Nasdaq 100 chart. We’re currently monitoring the Nasdaq 100 as price continues to trade within a critical technical structure, where both short-term momentum and higher timeframe levels are beginning to diverge. Key Supply Zone: 25,400 – 25,800 The 25,400 –…
-
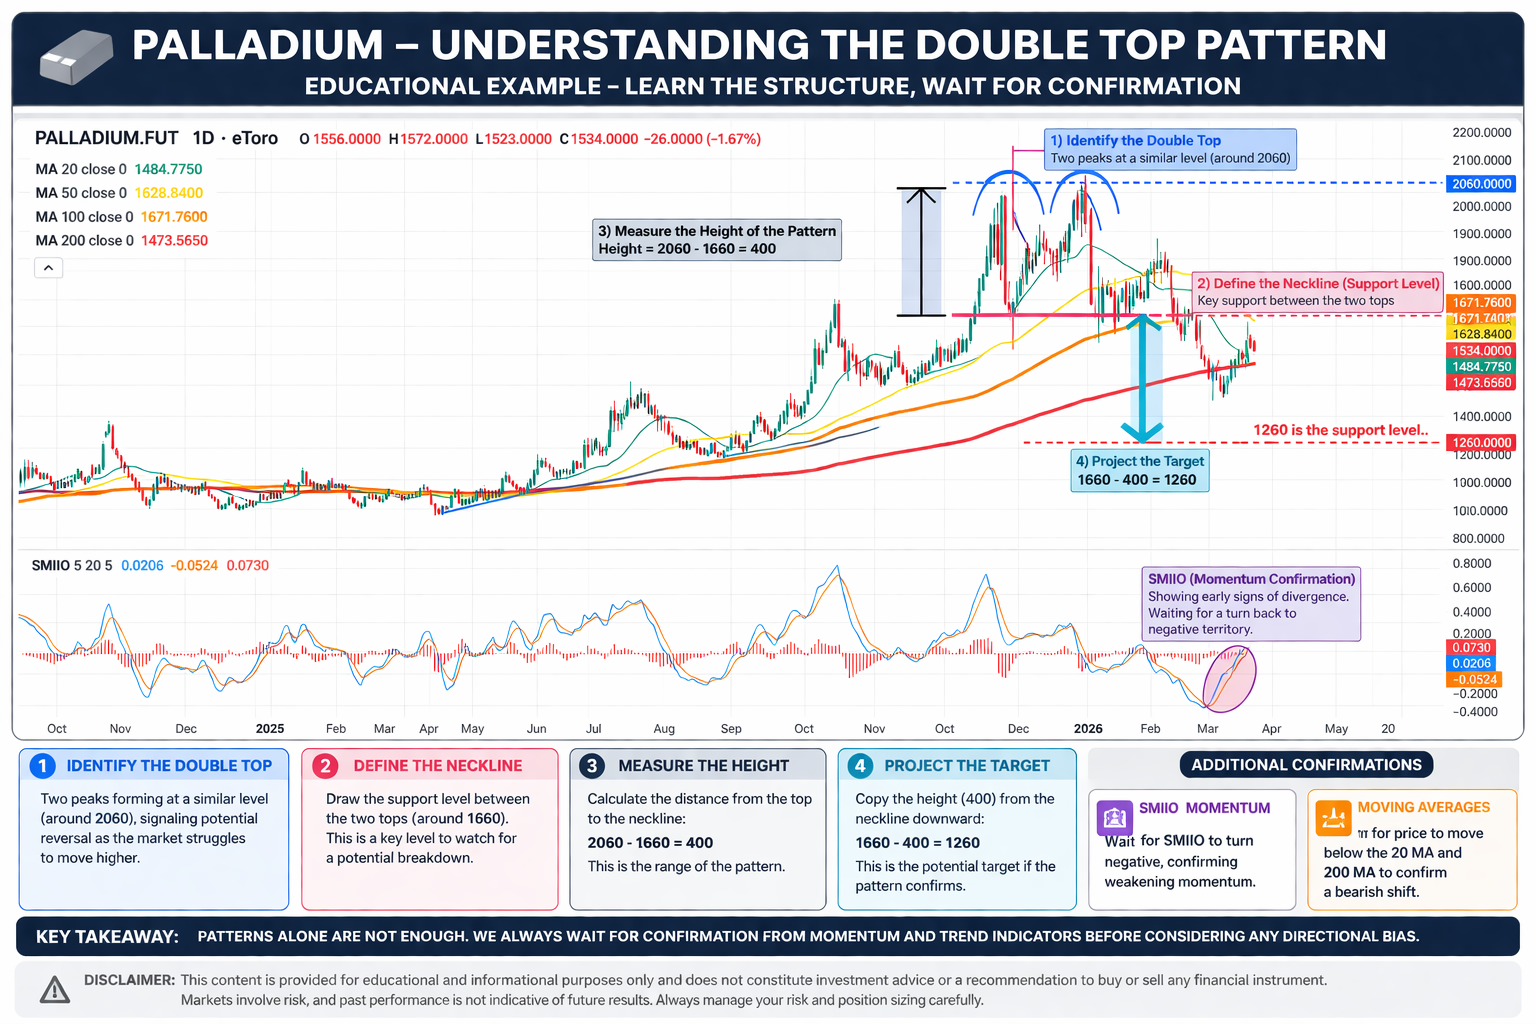
We’d like to share an educational example of how we approach the Double Top pattern, using the current Palladium chart. This is not about prediction, but about understanding structure and confirmation. Step-by-step approach:1) Identify the Double TopThe first step is to spot two peaks forming at a similar level (around 2060 in this case).This structure…
-
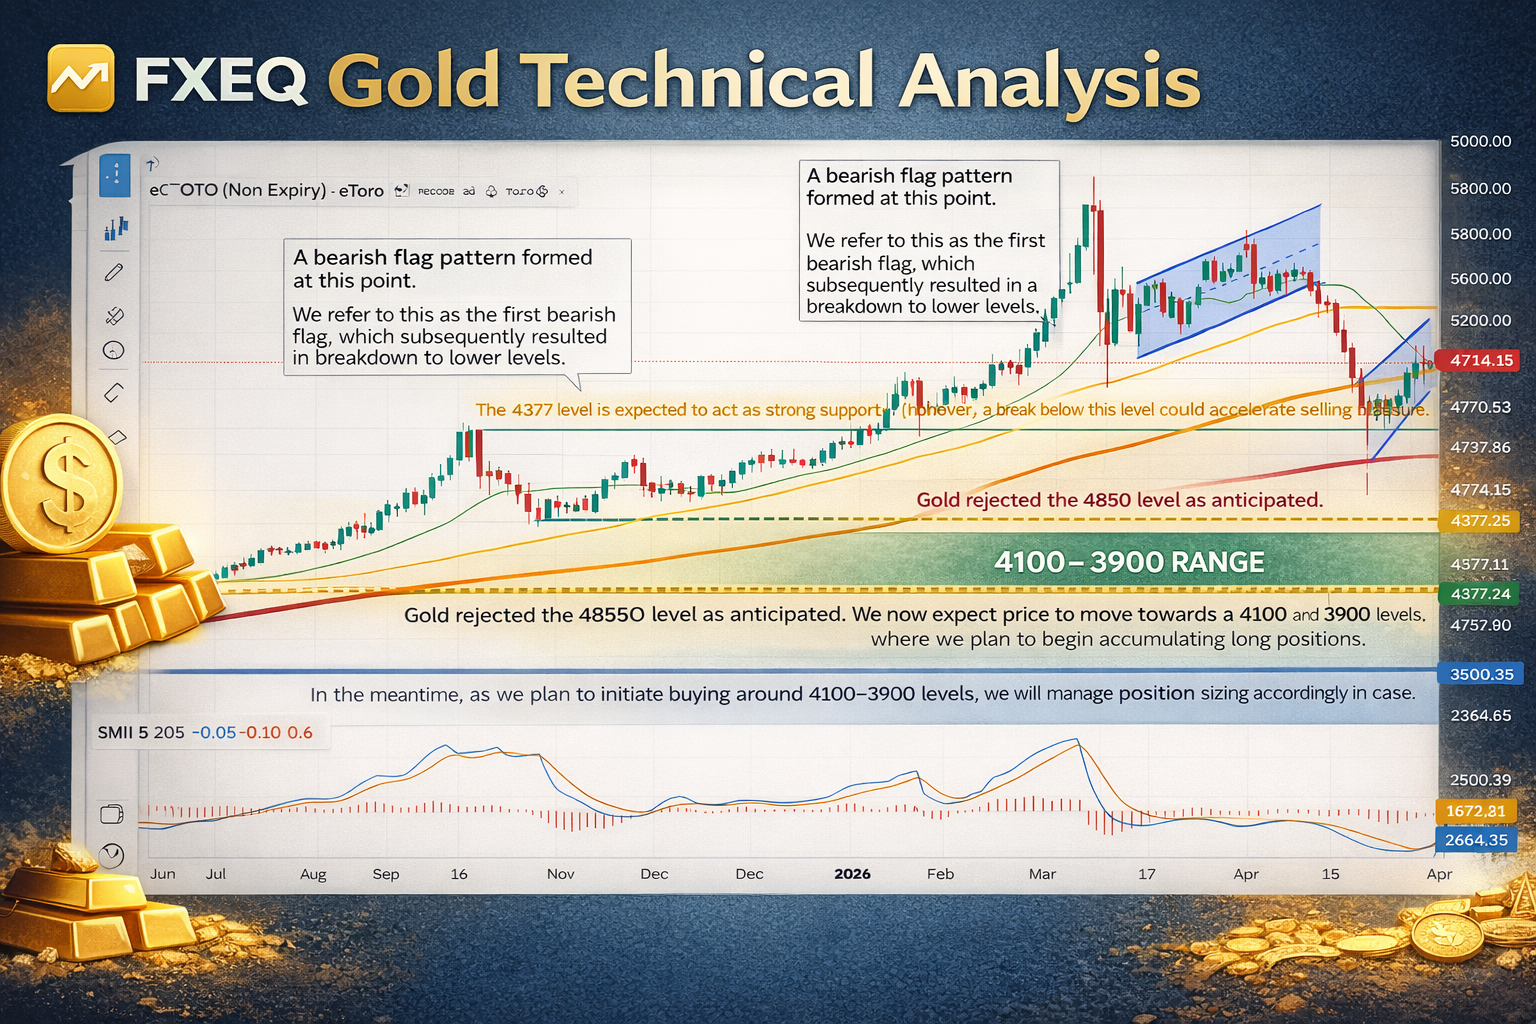
Educational Note | Multi-Timeframe Structure Analysis Gold continues to show signs of structural shifting. Following the rejection at the 4850 resistance level, we are observing a secondary bearish flag formation. While the symmetry is still evolving, the technical bias suggests a search for deeper liquidity. Key Technical Pillars: Support Watch: The 4377 level is the…
-
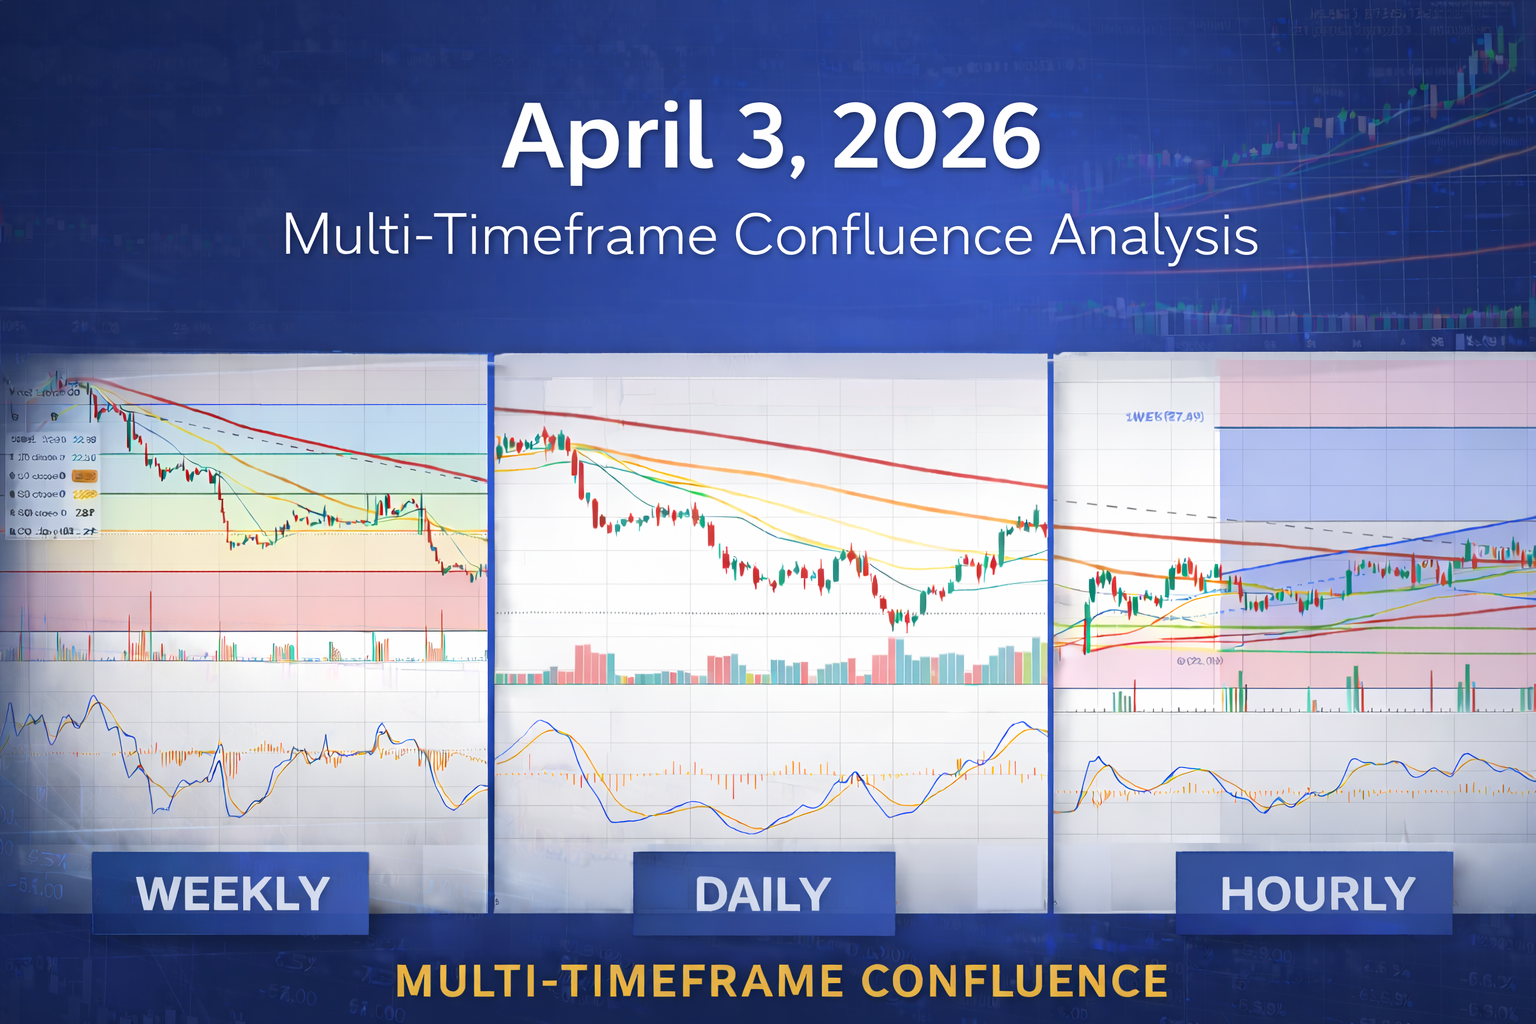
Date: April 3, 2026 | Educational Series: Multi-Timeframe Confluence At FXEQ Trading Limited, our methodology focuses on “Multi-Timeframe Confluence.” We don’t just look for a single signal; we look for the alignment of the Weekly, Daily, and Hourly trends to validate a high-conviction trade. Today, we are applying this framework to The Kraft Heinz Company…
-

Regulatory Notice: This article is issued by FXEQ Trading Limited for informational and educational purposes only. It does not constitute investment advice, a personal recommendation, or an offer to buy or sell securities. The value of investments can go down as well as up, and investors may not get back the full amount invested. Oklo…
-

Date: April 3, 2026 Asset: US Global Jets ETF (JETS) Current Price: $24.93 Overview The current macroeconomic environment is defined by divergence. While WTI Crude has surged to $112.04 following geopolitical tensions, creating an obvious headwind for the aviation sector, We are maintaining our long-standing position in the JETS ETF. This post outlines the technical…
-
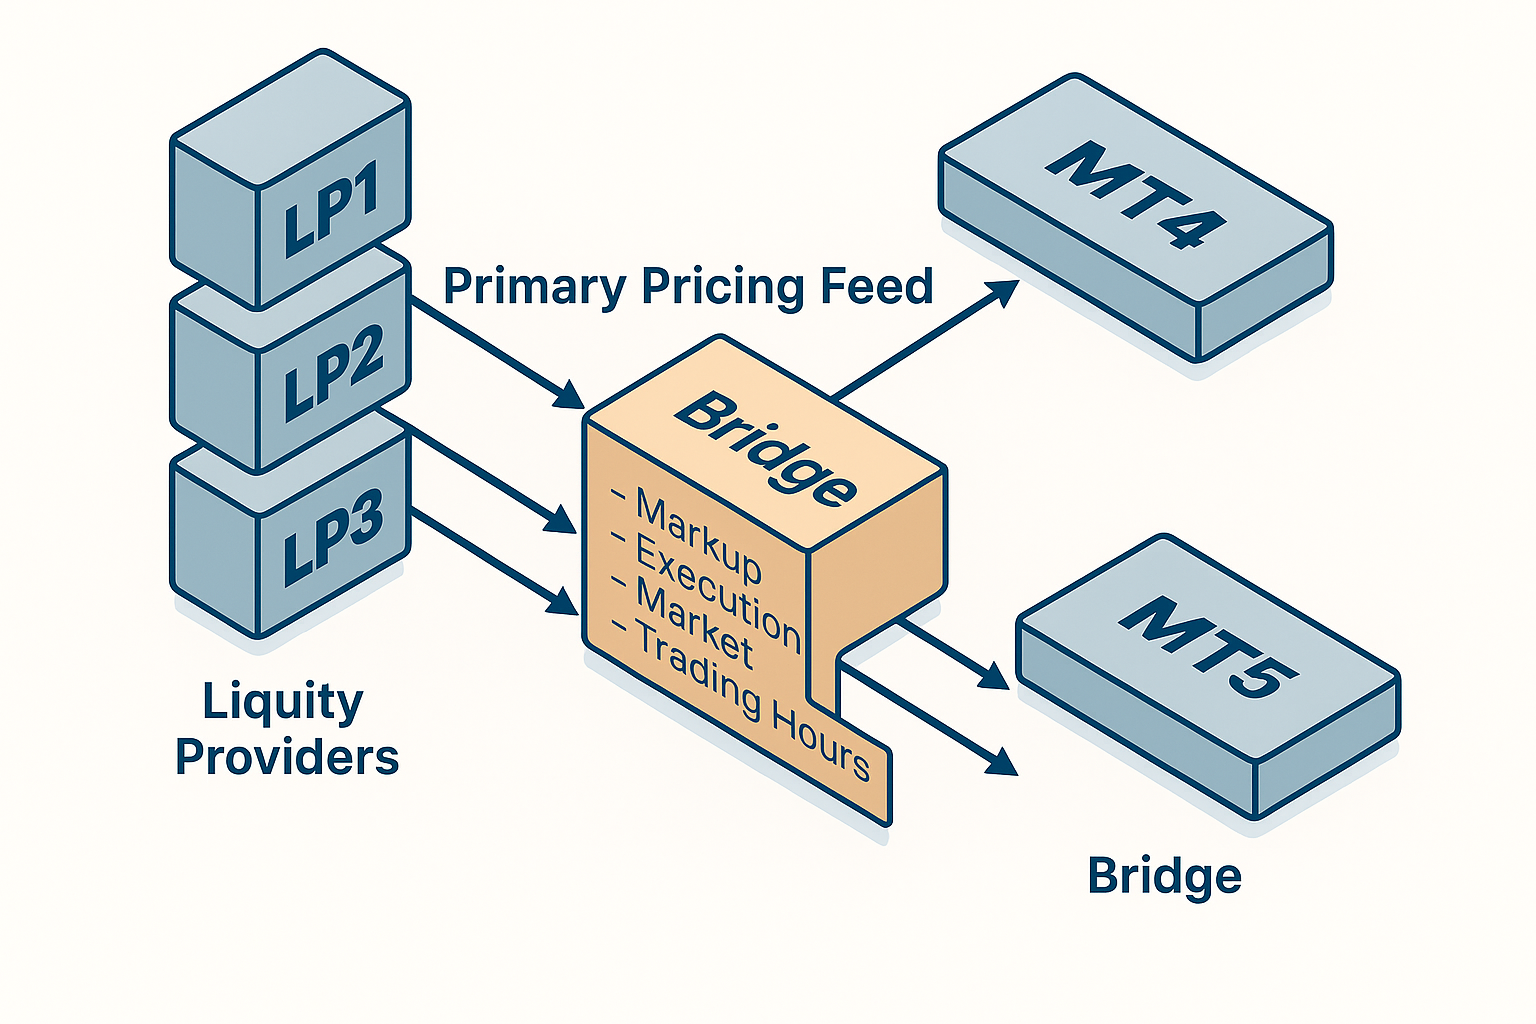
Introduction In the fast-moving world of forex trading, brokers must ensure they provide traders with the most competitive prices, fastest execution, and minimal downtime. Achieving this requires a carefully structured infrastructure — one that connects multiple Liquidity Providers (LPs) through a Bridge to popular trading platforms like MT4 and MT5. The Role of Liquidity Providers…