
Advanced Micro Devices Inc. (AMD) continues to exhibit price action that tracks the broader technology complex, moving in high-beta correlation with major benchmarks such as the Nasdaq 100 or QQQ. When evaluating the structural trajectory of AMD, mapping out established horizontal pivots alongside dynamic channel geometry provides a disciplined framework for tracking potential expansion zones and risk boundaries.
The Ascending Structural Channel
By connecting successive cyclical structural pivot points over the long-term trend, a prominent ascending channel boundary can be identified. Drawing a trendline across key lower highs and projecting a parallel channel extension up to the absolute structural peak establishes an upper target band. Based on this structural configuration, dynamic overhead resistance aligns near the $481 territory.
While this dynamic boundary maps out a logical target for bullish extensions, structural market geometry serves as a tracking mechanism rather than an absolute ceiling. Historical market expansions demonstrate that in strongly trending phases, price structures are fluid; an asset can consistently break through historical standard deviations to print higher institutional valuations. There is no permanent top level, and market geometry regularly expands to print higher price points. Therefore, the upper boundary represents an active area to monitor for potential deceleration rather than a definitive terminal top level.
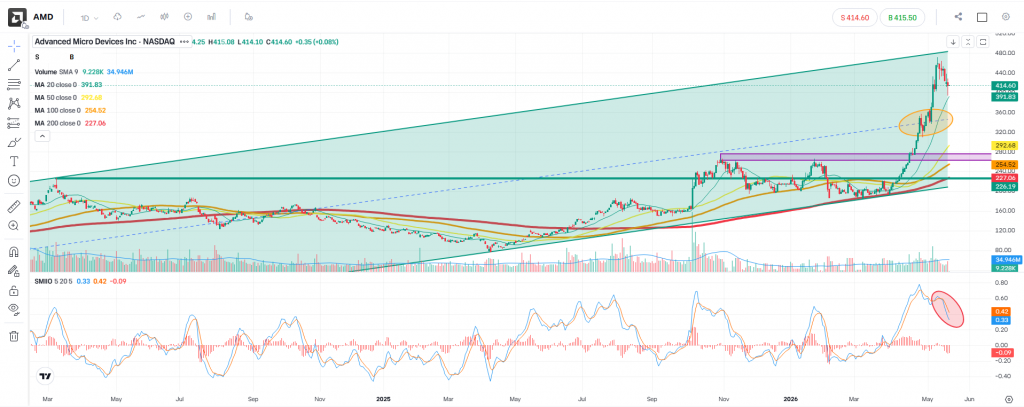
Key Structural Observation: Dynamic channel resistance maps toward the $481 level within the current ascending layout. However, price action remains inherently fluid, and secular expansions regularly transcend historical reference bands to establish new valuation tops.
Downside Reference Levels and Support Horizons
Given recent market fluctuations and indicators signaling short-term cooling from recent peaks, technical focus shifts toward mapping downside structure. Identifying these horizons helps spot where institutional buyers have historically stepped in. If the asset undergoes a broader corrective phase or a pullback, several key structural floors come into view:
| Technical Horizon | Structure Type | Technical and Structural Significance |
| $350 Region | Initial Support | Previous consolidation zone and near-term structural shelf where demand previously stabilized. |
| $250 – $280 Zone | Intermediate Support | Major historical resistance cluster; a retest represents a classic resistance-turned-support pivot. |
| $226 Area | Major Structural Floor | High-confluence support zone aligned with a significant historical breakout point. |
| 200-Day Moving Average | Dynamic Macro Floor | The long-term institutional trend indicator, acting as a critical baseline for the broader bullish trend. |
Risk Management and Structural Invalidation
A disciplined technical approach requires clear invalidation thresholds to protect capital against adverse market regimes. The primary structural floor for the long-term trend comprises the lower support line of the ascending channel aligned alongside the 200-day Simple Moving Average (DMA).
If the price prints a sustained drop below this ascending channel and the 200 DMA, the bullish regime is invalidated. From a strict risk management perspective, a decisive violation of these macro indicators serves as an invalidation signal, necessitating a defensive posture and the mitigation of exposed positions to curtail capital drawdown.
Disclaimer: This post is for educational and informational purposes only and should not be considered as financial or investment advice. Trading financial markets involves a high level of risk, and you should always conduct your own research or consult with a professional advisor before making any investment decisions. Past performance is not indicative of future results.
Leave a Reply