In the ever-volatile world of crude oil, moments of technical clarity combined with macro catalysts are rare — and potentially very rewarding. One such moment may be unfolding right now in WTI crude, where both chart structure and global headlines point to a potential move toward $80.
🧭 The Technical Setup: Price Vacuum at $75–$76.50
After a steady climb from sub-$70 levels, WTI crude surged toward $76.80 before stalling and consolidating just above $75. What’s particularly noteworthy here is the price gap between $75.00 and $76.50 — a partially unfilled zone that now acts as a magnetic range. This kind of structure often attracts price, especially when broader momentum remains intact.
Current price: ~$75.30
Gap zone: $75.00 – $76.50
Primary upside target: $80.00
📐 Fibonacci & Structural Confluence
Using the 1H chart, we mapped a Fibonacci retracement from the recent swing low ($72) to the high ($76.80). The levels line up with key price zones:
- 61.8% retracement (~$74.30) — acting as strong support
- 0% level (~$76.80) — the top of the gap
- 161.8% extension (~$80.00) — our technical price target
This Fibonacci alignment reinforces the bullish narrative and provides clear zones to manage entries and exits.
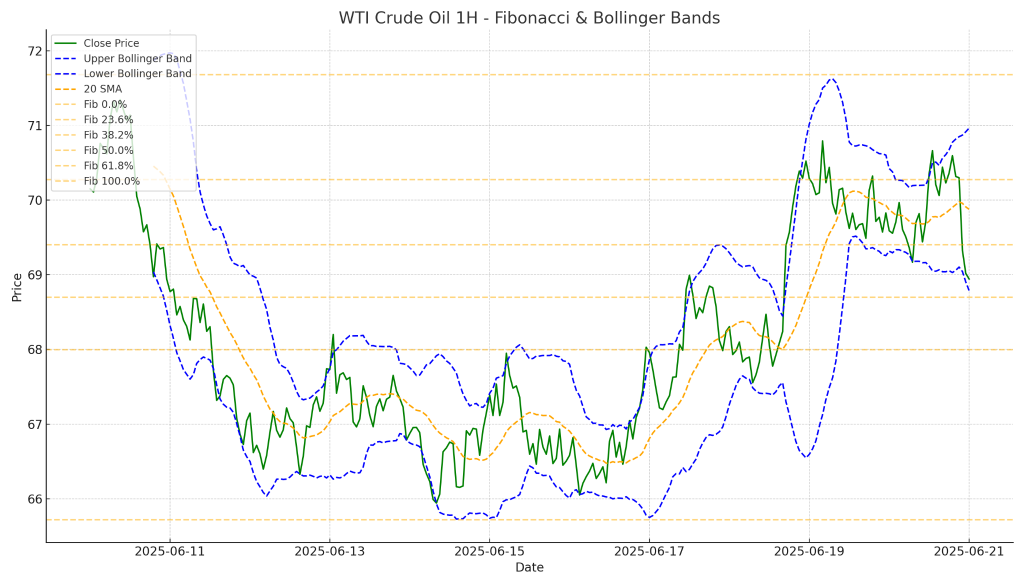
📊 Bollinger Band Compression Signals Breakout Potential
We’ve overlaid Bollinger Bands (20-period SMA, 2 standard deviations) to gauge volatility dynamics. Currently:
- Price has rebounded from the lower band and is trading near the median (SMA)
- The bands are tightening, indicating compression — often a prelude to breakout volatility
- The upper band is aligned with the top of the gap near $76.80
This structure supports a breakout bias, especially if the price can reclaim and sustain above $75.50.
🌍 Geopolitical Tailwinds: Middle East Tensions Rise Again
Beyond the charts, the broader oil narrative is heating up again — literally. Renewed tensions in the Middle East are injecting fresh volatility into the energy markets. Supply risk, even if speculative, tends to lift oil prices quickly, especially when paired with strong technicals.
This macro overlay provides fuel to the fire, aligning well with the chart-based gap play we’re watching.
🎯 FXEQ Trading Playbook
We believe this setup offers one of the better risk-reward opportunities on the board right now. Here’s how we’d approach it:
- Entry idea: Buy on dips in the $74.50–$75.00 range
- Stop-loss: Below $73.80 (under Fib support)
- Target 1: $76.50 (gap fill)
- Target 2: $80.00 (Fib extension + round number magnet)
📌 Final Thoughts
When technical structure, volatility signals, and geopolitical tension all converge, opportunity often follows. WTI is giving us such a signal. While nothing is guaranteed in trading, this is one setup worth watching — and possibly trading.
Please note that the content provided in this blog post is for informational and educational purposes only. It does not constitute investment advice, trading recommendations, or a solicitation to buy or sell any financial instrument. All views expressed are based on market observations and personal opinions at the time of writing.
Trading and investing in financial markets carry a high level of risk and may not be suitable for all investors. You should carefully consider your objectives, level of experience, and risk appetite before making any financial decision.
Past performance is not indicative of future results. Market conditions can change rapidly, and there is no guarantee that any forecasts, analysis, or opinions expressed will materialize. FXEQ Trading Limited and the author of this article accept no liability for any loss or damage, including without limitation any loss of profit, which may arise directly or indirectly from use of or reliance on such information.
Leave a Reply