We’d like to share an educational example of how we approach the Double Top pattern, using the current Palladium chart. This is not about prediction, but about understanding structure and confirmation.
Step-by-step approach:
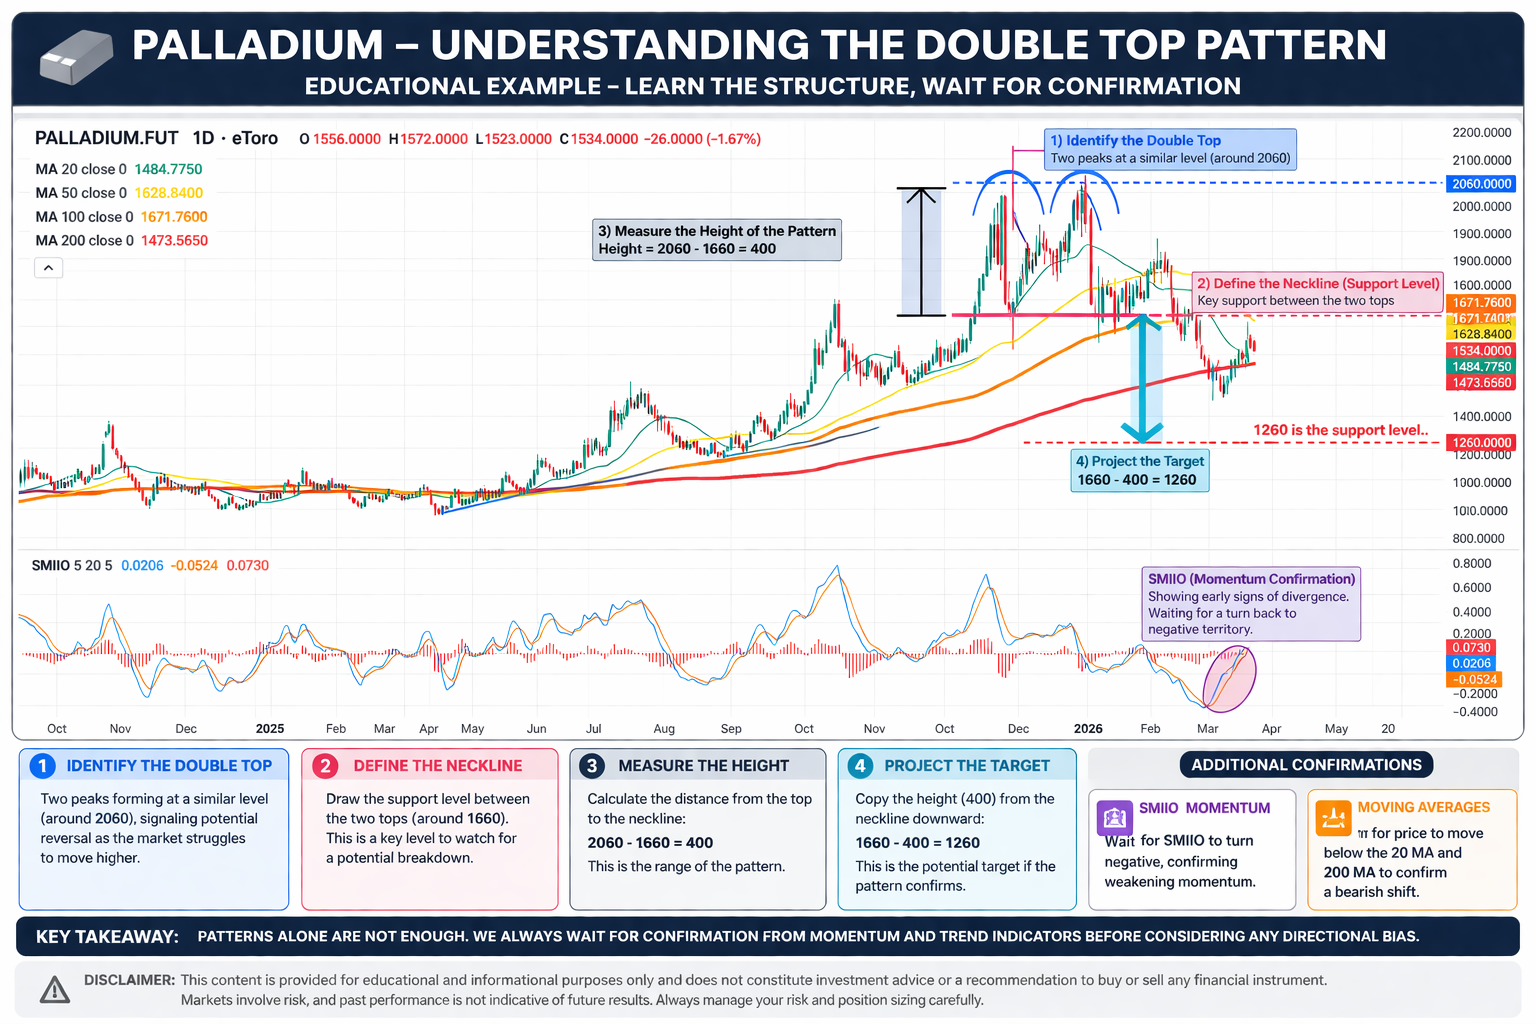
1) Identify the Double Top
The first step is to spot two peaks forming at a similar level (around 2060 in this case).
This structure often signals that the market is struggling to move higher and may be forming a potential reversal.
2) Define the neckline (support level)
We then draw the bottom level between the two tops.
This level acts as a key support, in this case, around the 1660 region.
3) Measure the height of the pattern
We measure the distance from the top (2060) of the pattern down (1660) to the neckline.
This gives us the “range” of the structure.
4) Project the target
We copy this same distance from the neckline downward.
This gives us a potential target level (1260) if the pattern confirms and breaks lower.
Additional confirmations we monitor:
- SMIIO (Momentum Confirmation)
We are waiting for SMIIO to turn back to negative territory.
At the moment, it is showing early signs of divergence, which can indicate weakening bullish momentum. - Moving Averages (Trend Confirmation)
We also look for price to move below key levels:
20 Day Moving Average
200 Day Moving Average
A break below these levels would strengthen the bearish case and confirm that the trend may be shifting lower.
Key takeaway:
Patterns alone are not enough.
We always wait for confirmation from momentum and trend indicators before considering any directional bias.
Disclaimer:
This content is provided for educational and informational purposes only and does not constitute investment advice or a recommendation to buy or sell any financial instrument. Markets involve risk, and past performance is not indicative of future results. Always manage your risk and position sizing carefully.
Leave a Reply