This is an educational piece where we share our approach to reading and interpreting the Nasdaq 100 chart.
We’re currently monitoring the Nasdaq 100 as price continues to trade within a critical technical structure, where both short-term momentum and higher timeframe levels are beginning to diverge.
Key Supply Zone: 25,400 – 25,800
The 25,400 – 25,800 region remains a well-defined supply zone, where we expect sellers to re-enter the market. This area has consistently acted as resistance, and until we see a clean break and sustained acceptance above it, the broader bias remains cautious.
From a structural standpoint, this zone represents a key decision point:
- Rejection here reinforces downside continuation
- Break and hold above may shift short-term sentiment
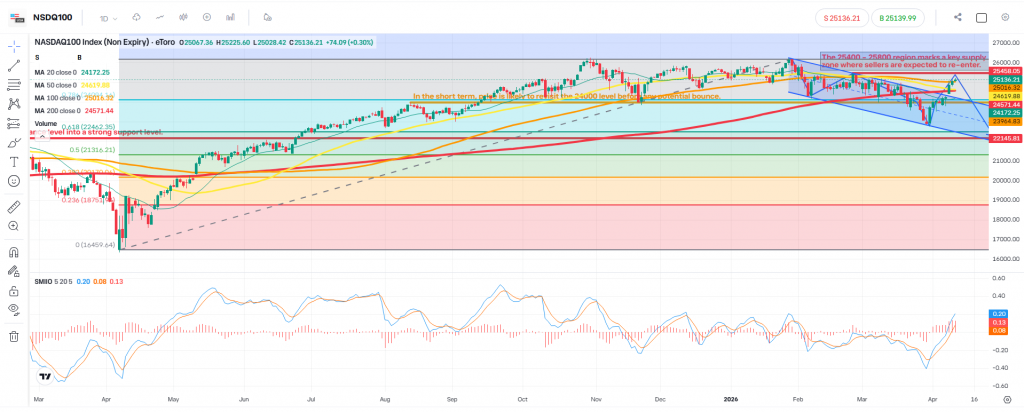
Short-Term Outlook: 24,500 in Focus
In the near term, price may revisit the 24,500 level, which acts as an interim support.
This level is important because:
- It aligns with recent price reactions
- It may serve as a bounce zone if buyers step in
- A break below could accelerate downside momentum
Higher Timeframe Perspective
On the higher timeframe, 22,145 remains a major support level.
This is a structurally significant zone where:
- Long-term buyers may become active
- Market sentiment could stabilise
- A deeper correction may find its base
Momentum vs Structure
While we are seeing short-term recovery in momentum, it is not yet strong enough to confirm a sustained bullish move.
At this stage:
- Momentum suggests a bounce
- Structure still leans bearish
This mismatch is often where traders get caught — which is why confirmation remains key.
Our View
From a structural perspective, this move appears to be:
A corrective bounce within a broader bearish framework, not a confirmed reversal.
As always, our focus remains on:
- Execution
- Risk management
- Position sizing
— not prediction.
📌 Final Thoughts
We continue to monitor how price behaves around key levels, particularly the supply zone above and support levels below. The market will ultimately decide direction. Our role is simply to interpret and respond.
⚠️ Disclaimer
This analysis is provided for educational and informational purposes only and does not constitute investment advice or a recommendation to buy or sell any financial instrument. Markets involve risk, and past performance is not indicative of future results.
Leave a Reply