This is an educational breakdown of how we read developing recovery structures using price action, momentum, and volume. The goal is not to predict, but to understand how confirmation builds over time.
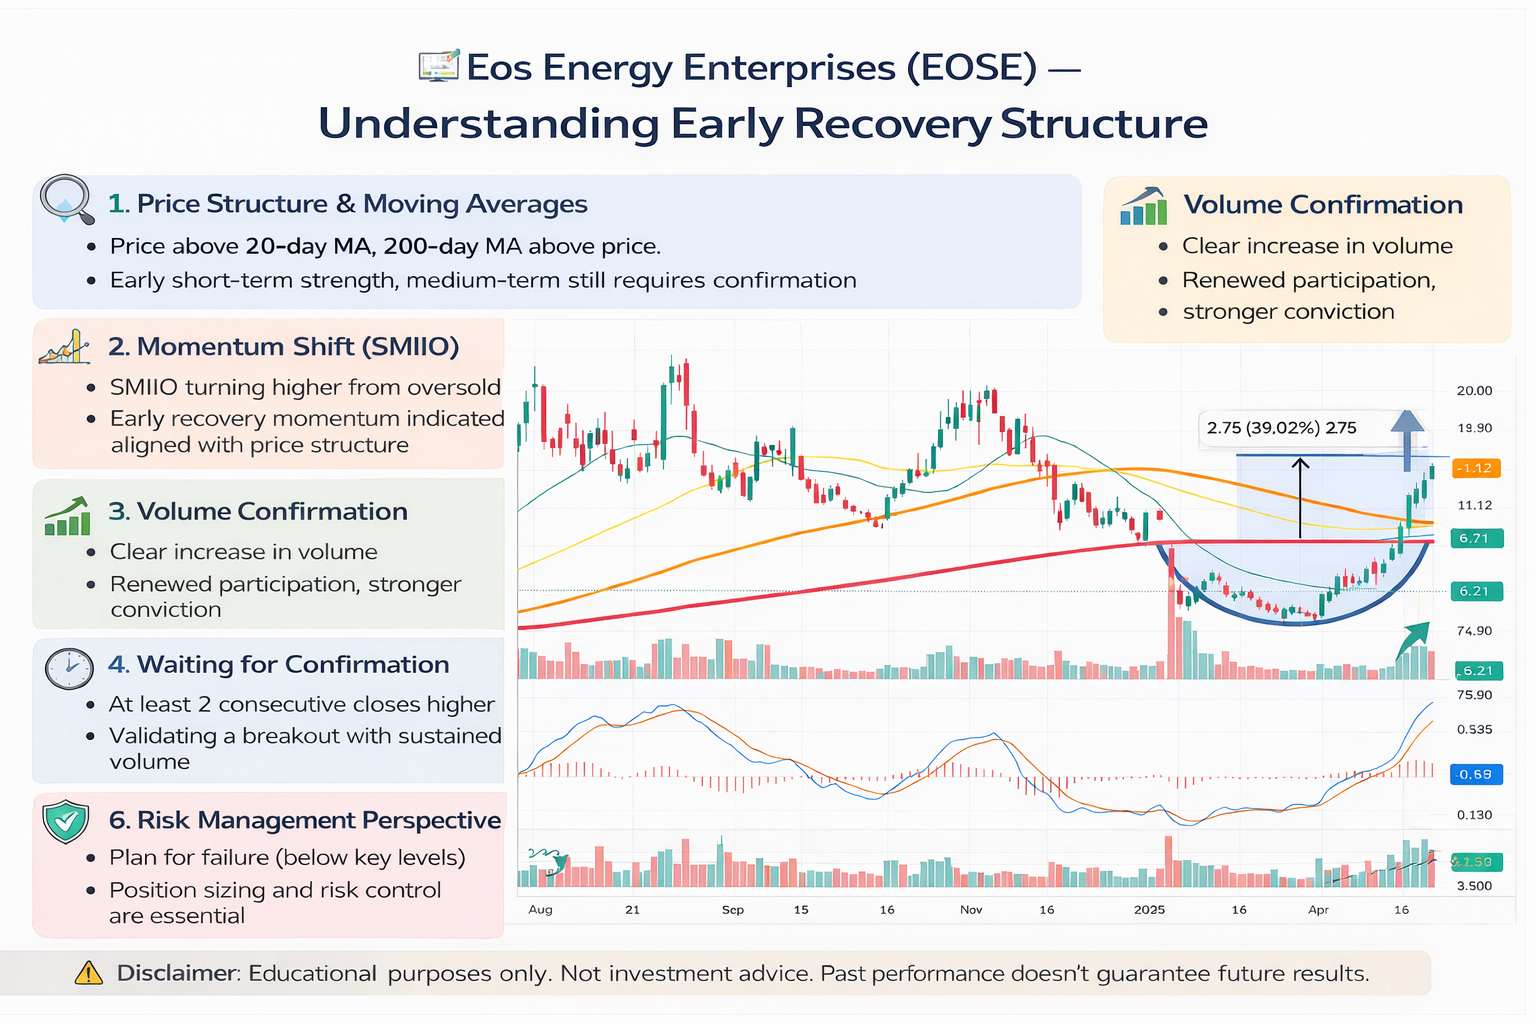
1) Price Structure & Moving Averages
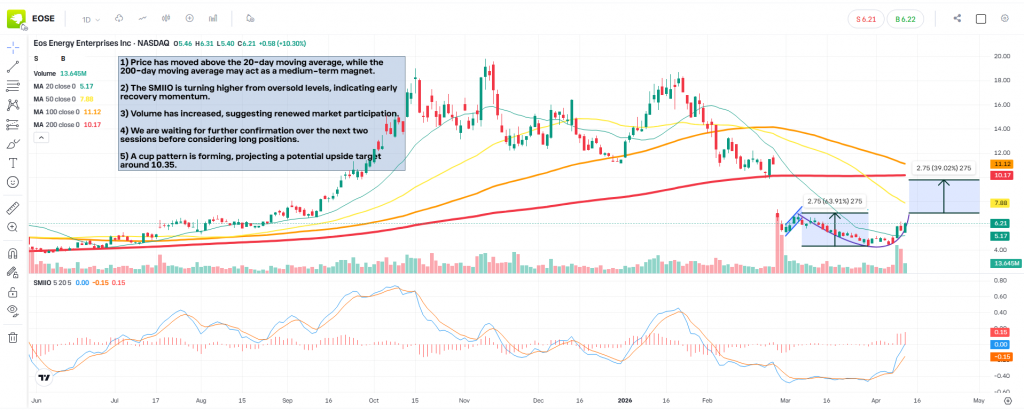
Price has recently moved above the 20-day moving average, which often signals early short-term strength.
However, the 200-day moving average remains above price, acting as a potential medium-term resistance or “magnet”.
👉 In practice:
- Short-term momentum is improving
- Medium-term structure still requires confirmation
2) Momentum Shift (SMIIO)
The SMI indicator is turning higher from oversold levels, which suggests that downside momentum is fading and early buying interest is returning.
This type of shift is often seen at:
- Early stages of reversals
- Or within temporary recoveries inside broader trends
👉 Important: Momentum alone is not enough — it must align with price structure.
3) Volume Confirmation
We can observe a clear increase in volume, indicating:
- Renewed participation
- Stronger conviction behind the recent move
Volume is critical because:
- Price moves without volume tend to fail
- Rising volume supports the validity of a potential structure
4) Waiting for Confirmation
At this stage, we are not acting, we are waiting.
The key confirmation we look for:
- At least two consecutive daily closes higher
- Each candle closing above the previous one
- Ideally supported by sustained volume
👉 This helps filter out false breakouts and weak moves.
5) Cup Formation & Structure Projection
A rounded “cup-like” structure appears to be forming, which typically represents:
- Gradual accumulation
- Transition from selling pressure to buying pressure
Using structure projection:
- The depth of the formation can be used to estimate a potential upside region
- In this case, the projected area sits around 10.35
👉 This is not a target, it is simply a reference level derived from structure
6) Risk Management Perspective
As always, structure can fail.
If price:
- Loses momentum
- Falls back below key moving averages
- Or breaks the recovery structure
👉 Then the scenario becomes invalid.
This is why position sizing and risk control are essential — every trade idea must assume the possibility of failure.
Final Thoughts
What we are observing here is a developing recovery phase, supported by:
- Short-term trend improvement
- Momentum shift
- Increasing volume
However, confirmation is still required before any strong directional bias can be considered.
In trading, patience is often the edge, not prediction.
Disclaimer
This analysis is provided for educational and informational purposes only and does not constitute investment advice or a recommendation to buy or sell any financial instrument. Markets involve risk, and past performance is not indicative of future results. Always manage your risk and position sizing accordingly.
Leave a Reply