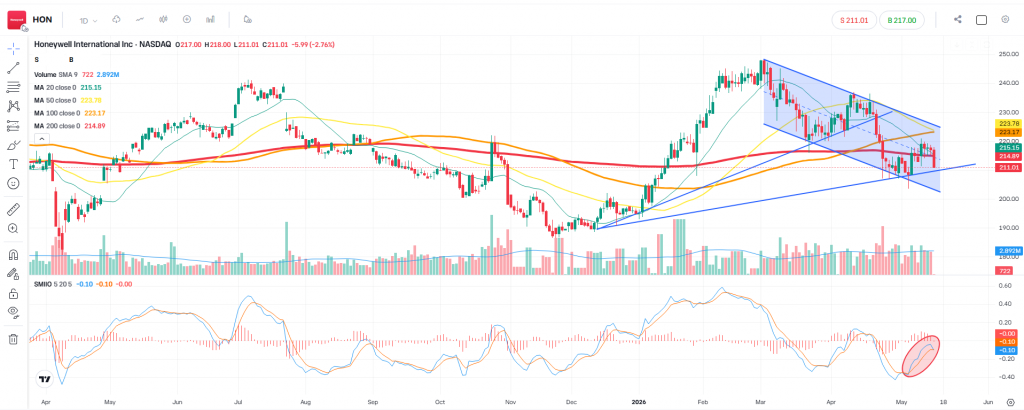
Six days ago, we flagged a highly structured bearish setup developing on Honeywell International Inc. ($HON). At the time, the price action was tightly bound within a prominent descending bearish channel, pinned beneath the critical 200-day Moving Average ($214.87), with the SMIO pointing toward early sell-side momentum.
However, we emphasized a strict operational rule: a confirmed short position required two consecutive daily closes below the primary ascending trendline. Today, we review how that patience paid off and analyse the crucial “tug-of-war” currently taking place on the daily chart.
The 6-Day Development: Why the Trigger Never Fired
Markets rarely move in a straight line, and HON provided a textbook example of why breakdown confirmation rules are vital.
On May 15, the bears launched an aggressive assault, pushing the stock down to an intraday low of $211.50. This move momentarily sliced straight through our highlighted ascending trendline support. To an impatient trader, this looked like the breakdown. However, buyers stepped in before the closing bell, dragging the price back up to close at $213.24.
Because the price failed to log back-to-back daily closes below the line, our mechanical short trigger never validated. Over the subsequent sessions, HON rebounded, stabilizing back above the crucial threshold.
| Date | Open | High | Low | Close | Volume |
| May 14 | $217.59 | $218.95 | $215.76 | $217.72 | 3.37M |
| May 15 | $215.03 | $215.64 | $211.50 | $213.24 | 4.46M |
| May 18 | $215.28 | $219.11 | $214.87 | $217.23 | 4.45M |
| May 19 | $216.95 | $218.32 | $214.77 | $217.15 | 4.03M |
| May 20 | $216.95 | $218.32 | $214.77 | $217.39 | 1.99M |
Current Technical Outlook: The Three-Way Battleground
As seen on today’s updated chart, the immediate, steep descending channel has shifted into a broader, key inflection point (now highlighted in red/orange). The price action has flattened out, turning into a battlefield where three major technical indicators converge:
- The Ascending Trendline: This primary macro support line (green) continues to act as a floor. Every attempt by sellers to break it has been met with immediate absorption from buyers.
- The 200 DMA: The 200-day moving average (currently tracking at $214.80) is right in the thick of the price action. The fact that HON has spent the last three sessions closing slightly above it ($217.39 yesterday) shows that the bulls are fighting aggressively to reclaim this line as support rather than resistance.
- The SMIO Shift: Notably, the SMIO momentum indicator in our lower panel (circled in green) has curved upward out of oversold territory. This shift hints that sell-side momentum is temporarily drying up, fueling the current consolidation.
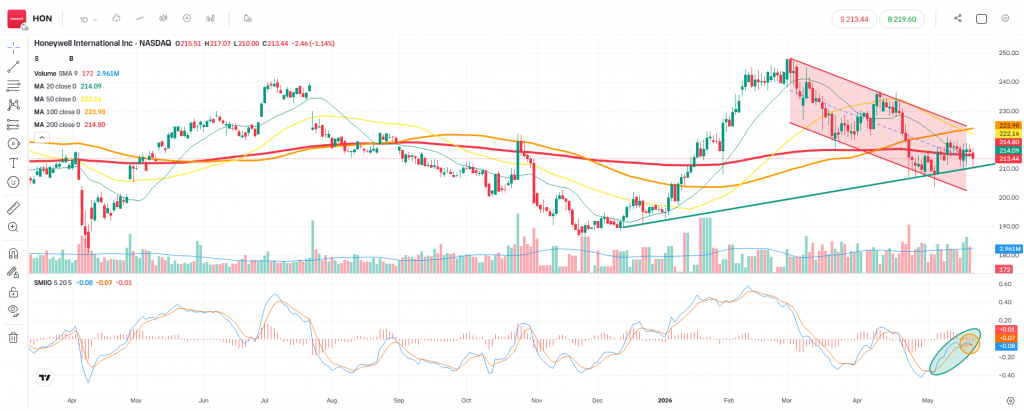
How We Are Trading It Next
The technical narrative for HON has evolved from a clean breakdown setup into a high-stakes compression zone.
- The Bearish Case: The overarching descending structure remains a cap on structural upside. If the bulls fail to generate real separation above $218–$220, a clean breakdown of the green trendline, confirmed by our original rule of two consecutive daily closes below it, will likely open the floodgates down toward psychological support at $200.
- The Bullish Case: If the SMIO momentum continues to curl upward and HON cleanly establishes the 200 DMA as a launchpad, we look for a test of the upper descending boundary near $222–$223.
The Verdict: Let’s see who wins the battle. We remain neutral and patient, letting the market declare its direction at this crucial structural junction.
Disclaimer: This post is for educational and informational purposes only and should not be considered as financial or investment advice. Trading financial markets involves a high level of risk, and you should always conduct your own research or consult with a professional advisor before making any investment decisions. Past performance is not indicative of future results.
Leave a Reply