
An objective assessment of the daily chart for Cameco Corp. (NASDAQ: CCJ) reveals a critical inflection point. While the equity has enjoyed a sustained, long-term bullish trajectory within a well-defined ascending channel, recent price action demands strict technical vigilance.
The market is currently testing the structural integrity of its established trend, presenting a textbook scenario where discipline must precede bias.
Key Technical Observations
- Channel Integrity & Price Action: Over the last two trading sessions, price action has pressured the lower boundary of the primary ascending channel, threatening a formal downside breach.
- The Significance of $103.00: The $103.00 level stands as a pivotal line in the sand. This Critical Level serves as immediate horizontal support; a decisive failure here shifts the near-term market structure from bullish consolidation to a potential trend reversal.
- Moving Average Confluence: The price is currently trading below its 20-day, 50-day, and 100-day Daily Moving Averages (DMAs). However, the 200-day DMA (currently at 98.17) remains safely below current price action, acting as the ultimate macro baseline for the broader bullish trend.
- Momentum Indicator (SMIIO): The SMIIO indicator has drifted into negative territory, accompanied by bearish crossover momentum (highlighted in the red oval). This confirms accelerating downside pressure in the immediate term, though it remains a lagging reflection of price.
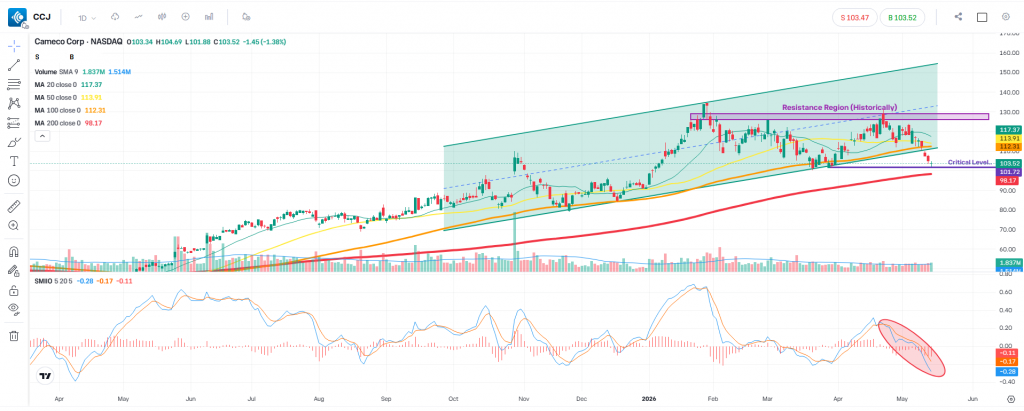
Strategic Outlook & Execution Strategy
In alignment with a professional trading methodology, we eschew prediction in favour of reaction. The objective is not to guess whether CCJ will bounce or break, but to establish clear, binary rules for execution.
| Scenario | Structural Condition | Execution Rule |
| Scenario A: Bullish Reclamation | Price maintains a firm footing above the $103.00 critical level, successfully defends the 200 DMA, and re-enters the ascending channel. | Await a formal confirmation candle inside the channel before considering long exposure, targeting the historical Resistance Region ($126.00–$130.00). |
| Scenario B: Bearish Breakdown | Price decisively closes below $103.00, invalidating immediate support and opening the door to a test of the 200 DMA. | Stand aside or look for clear transition setups, recognizing that a structural shift in medium-term direction is underway. |
The Trader’s Mandate: We do not predict the future; we manage probability. The most prudent course of action is to define your parameters, wait for definitive structural confirmations, and execute without hesitation once those rules are met.
Disclaimer: This content is provided for educational and informational purposes only and does not constitute investment advice or a recommendation to buy or sell any financial instrument. Markets involve risk, and past performance is not indicative of future results. Always manage your risk and position sizing carefully.
Leave a Reply