

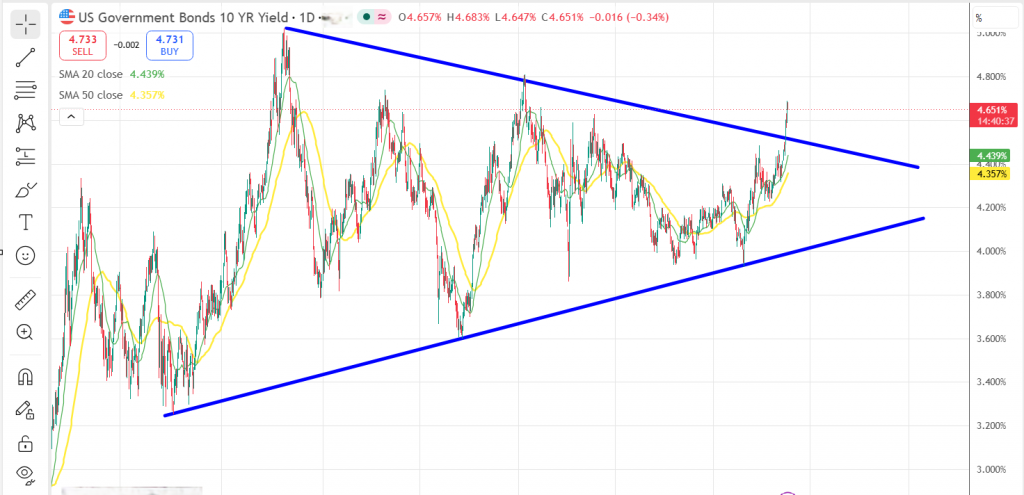
Anyone may write any reason behind the drop, however, the way we read the chart fundamentally is that the US 10-Year Treasury Yield has relentlessly climbed toward the 4.66% mark, injecting significant momentum into the US Dollar. For non-yielding precious metals and highly volatile beta-2.1 miners like AG (First Majestic Silver Corp.), this surge in real yields acts as a massive anchor.
As always, we do the job from a technical point of view. Below is our current structural assessment of the daily chart.
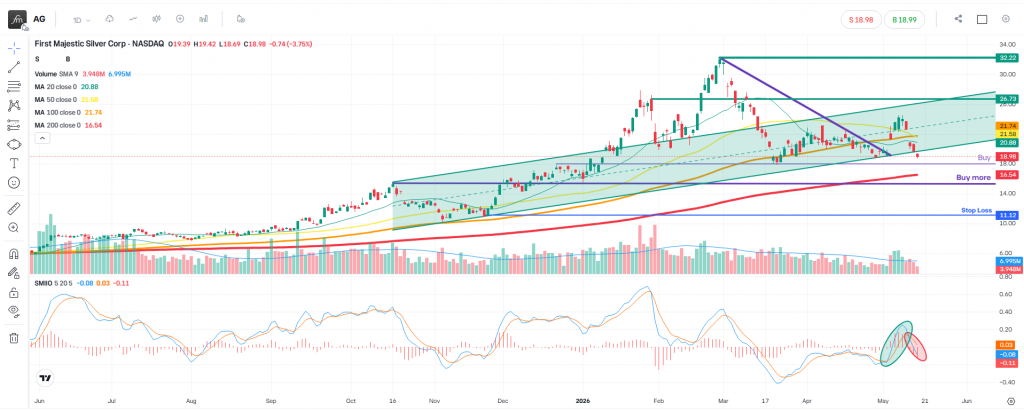
Key Technical Indicators & Moving Averages
| Indicator / Moving Average | Current Value | Technical Status |
| MA 20 (Close) | $20.87 | Broken / Turning into Overhead Resistance |
| MA 50 (Close) | $21.58 | Broken / Turning into Overhead Resistance |
| MA 100 (Close) | $21.73 | Key Structural Junction |
| MA 200 (Close) | $16.54 | Structural Magnet / Reversion Target |
| Current Price (C) | $18.80 (-4.67%) | Compressing Lower |
Deep-Dive Analysis
- The Moving Average Cluster: The price has decisively broken below the 20-day (blue) and 50-day (yellow) Daily Moving Averages (DMAs). These short- to medium-term indicators are now flattening out and turning into overhead resistance.
- Support Breach: The horizontal purple line highlighting previous structural support has been breached on a daily closing basis. The price is now compressing directly against the 100-DMA (orange), which is currently hovering just above the $21.00 level on the historical layout.
- The 200-DMA Magnet: With the primary upward trend structure compromised, technical gravity dictates that the rising 200-DMA (red), currently situated lower down near $16.54, will act as a structural magnet. In deep corrective phases following a massive multi-month run (AG is up over 300% over the past year), a reversion to the mean is the path of least resistance.
- SMI Momentum: The Stochastic Momentum Index (SMI) at the bottom clearly mirrors this breakdown, with the signal lines deeply embedded in negative territory (circled in red), confirming that selling pressure has not yet reached exhaustion.
Critical Levels to Watch
| Level Type | Price / Indicator | Market Context |
| Resistance Zone | $21.58 – $21.73 | Confluence of 50-DMA and 100-DMA |
| Major Resistance | $26.73 / $32.22 | Previous Swing Highs / Distribution Peaks |
| Invalidation / Stop Loss | $11.12 | Core Structural Floor |
Concluding Thoughts
The intersection of macro headwinds and broken technical structures suggests caution in the near term. Until AG can stabilise above its short-term moving averages or test the deep structural support of the 200-DMA, the bears remain in control of the immediate price action.
Disclaimer Not Financial Advice. This technical analysis is shared strictly for educational and informational purposes. The views expressed represent a study of chart structures and macro indicators, not an explicit recommendation to buy, sell, or hold any financial instrument. The author may hold financial interests in the monitored instruments. Always execute independent risk management.
Leave a Reply