

In professional trading, the validity of a technical setup lasts only as long as the market honors its structural boundaries. A highly probable setup can disintegrate in a single session, and when it does, the difference between a minor loss and a catastrophic drawdown lies entirely in swift, un-emotional execution.
This case study examines our recent technical tracking of Barrick Gold Corp (NYSE: GOLD) on the daily timeframe, contrasting our initial bullish technical thesis on May 14, 2026, with the stark structural deterioration observed today, May 20, 2026.
Part 1: The Initial Technical Thesis (14/05/2026)
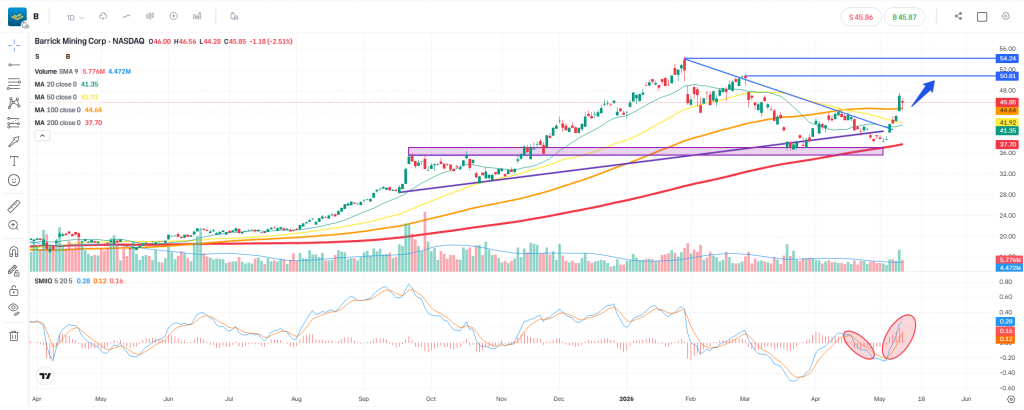
On May 14, the daily chart for Barrick Gold presented an textbook bullish accumulation and breakout pattern that strongly favored an extension to the upside.
What We Observed:
- The Breakout: Price action successfully penetrated a well-defined, multi-month descending trendline originating from the October highs.
- Moving Average Alignment: The asset was trading cleanly above its key exponential and simple moving averages, specifically the 20, 50, 100, and 200-day MAs signaling strong multi-frame bullish alignment.
- Momentum Support: The SMI Ergodic Indicator (SMIIO) was turning positive, confirming that buyers were stepping in with accelerating momentum at the breakout point.
Our Initial Strategy:
Backed by broader macroeconomic tailwinds in the precious metals sector, our outlook anticipated a sustained move toward key horizontal resistance targets at $50.81 and $54.24. A structural hard stop was placed safely at $30.49, with plans to employ a tight trailing stop upon a successful test of the upper levels.
Part 2: The Structural Shift (20/05/2026)
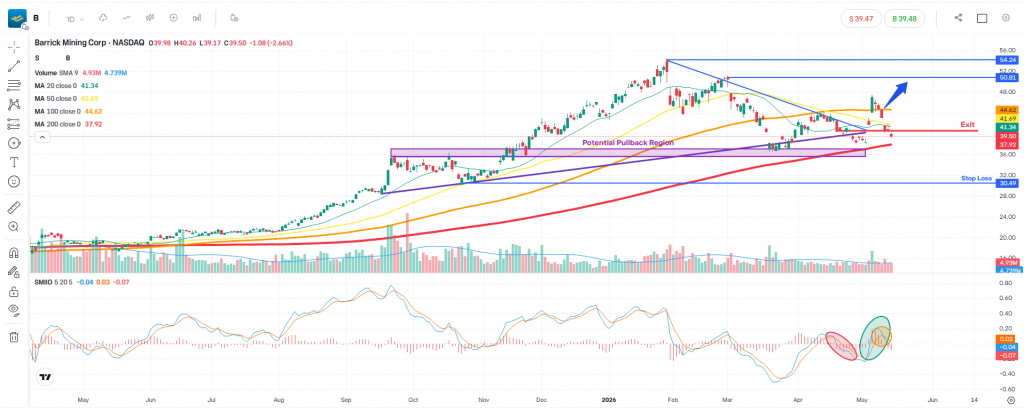
Markets are dynamic, and price action will always override narrative. Over the subsequent trading sessions, the expected bullish follow-through failed to materialise. Instead, institutional distribution rapidly reshaped the daily chart.
What Went Wrong:
- The Bull Trap Confirmed: Rather than holding the descending trendline as new structural support, the price broke back underneath it. This price behavior effectively confirmed that the previous breakout was a classic “bull trap.”
- Moving Average Cascades: The market aggressively sold off, causing the price to slide beneath the 20, 50, and 100-day moving averages in rapid succession. The loss of these dynamic support levels invalidated the immediate bullish thesis.
- Momentum Overturn: The SMIIO indicator quickly rolled over, showing a bearish crossover in negative territory, validating the surge in institutional selling volume.
Part 3: The Tactical Decision – Why We Exit
When a technical thesis is invalidated, waiting for a distant hard stop to be triggered is a sub-optimal strategy. Our approach dictates that we preserve capital the moment the chart’s structural integrity is compromised.
| Metric / Level | Initial Read (14/05/2026) | Current Read (20/05/2026) | Actionable Impact |
| Market Structure | Bullish Breakout | Confirmed Bull Trap | Technical Invalidation |
| Moving Averages | Above 20, 50, 100, 200 MAs | Below 20, 50, 100 MAs | Loss of Dynamic Support |
| SMIIO Momentum | Turning Positive | Bearish Crossover | Downside Acceleration |
| Tactical Mandate | Hold for Targets ($50.81) | Immediate Market Exit | Capital Preservation |
The FXEQ Takeaway:
We choose to exit the position entirely at the current market juncture. Rather than hoping for a reversal or exposing capital to a potential test of the lower structural bands near $30.49, we stay sidelined.
Stepping away allows us to remain liquid and objective. We will wait patiently for the market to fully restructure itself, look for fresh accumulation signs, and wait for a verified, high-probability re-entry signal before allocating further capital to this asset.
Patience over prediction. The chart changed, and we changed with it.
Disclaimer: The analysis above is for educational purposes only and does not constitute financial or investment advice. Trading leveraged instruments such as CFDs carries a high level of risk to capital.
Leave a Reply