
Retrospective: The Bullish Thesis
In our previous analysis, Capital One (COF): Saucer Formation at Key Level Within Bullish Channel, we highlighted a highly promising structural setup. The stock was carving out a clean, rounded bottoming structure within a dominant, long-term ascending channel. This alignment of multi-month support and structural accumulation pointed toward a powerful continuation move, suggesting that buyers were firmly in control at key macro levels.
The Mid-April Setup and Subsequent Invalidation
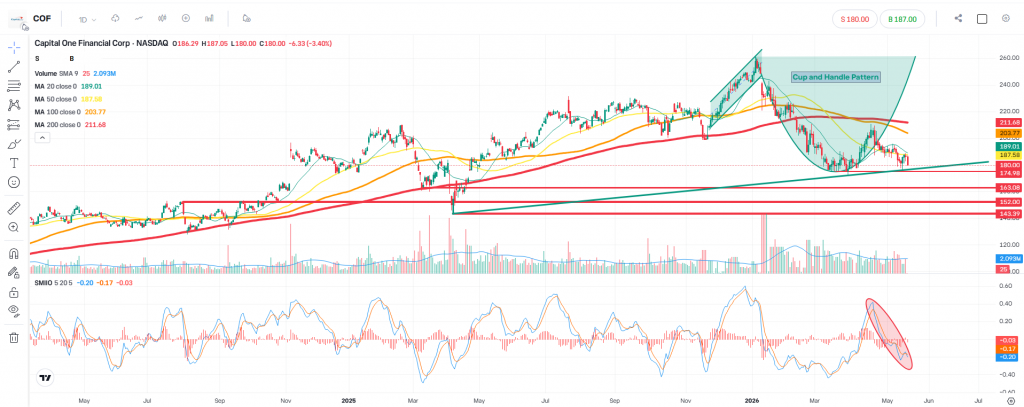
Building on that structural optimism, a clear Cup and Handle pattern was identified in mid-April 2026. This classic continuation configuration typically signals a period of brief consolidation before an aggressive bullish breakout.
However, the market has failed to deliver the necessary follow-through, and the expected bullish resolution did not materialise:
- Moving Average Breakdown: The price action has decisively weakened, slipping and sustaining below its key Daily Moving Averages (DMAs). The failure to hold above these dynamic indicators highlights a distinct shift in short-term momentum from bullish to defensive.
- Oscillator Confirmation: This loss of momentum is explicitly confirmed by the SMI Ergodic Oscillator (SMIIO). As highlighted in the red oval, the SMIIO lines have crossed downward and are accelerating into negative territory, validating the strength of the current selling pressure.
Current Technical Levels & Risk Management Playbook
With the initial breakout thesis invalidated, the focus turns entirely to risk management and identifying defensive support zones:
- Immediate Support (The Dynamic Line): In the short term, the price is approaching a green ascending trendline. If buyers are to mount a defense, this structural line must hold.
- The Line in the Sand (175.00): If the ascending trendline fails to hold the decline, the absolute structural floor for the current setup rests at 175.00, the swing low forming the base of the cup. A daily close below this level officially invalidates the integrity of the pattern, serving as our strict exit level to contain losses.
- The Re-entry Zone (140.00 – 160.00): Should the 175.00 floor break, we will step aside and allow the correction to run its course. A deeper pullback into the major horizontal support region between 140.00 and 160.00 would offer a highly compelling, lower-risk opportunity to re-evaluate and potentially re-establish long positions at a significant discount.
| Parameter | Technical Level / Zone | Strategy / Action |
| Current Pattern Status | Cup & Handle | Invalidated (Failed to trigger) |
| Immediate Focus | Green Ascending Trendline | Monitor for signs of stabilization |
| Strict Exit Level | 175.00 (Cup Bottom) | Disjoint position with loss if broken |
| Potential Re-entry Zone | 140.00 – 160.00 | Re-consider long exposure on pullback |
Conclusion: Capital preservation remains paramount when a highly structured pattern fails to trigger. We remain disciplined, watching the immediate support levels closely, while keeping a keen eye on the broader value region lower down if the current correction extends.
Disclaimer
This analysis is for education and informational purposes only. It does not constitute investment advice or a recommendation to buy or sell any financial instrument. Always conduct your own research and apply proper risk management.
Leave a Reply