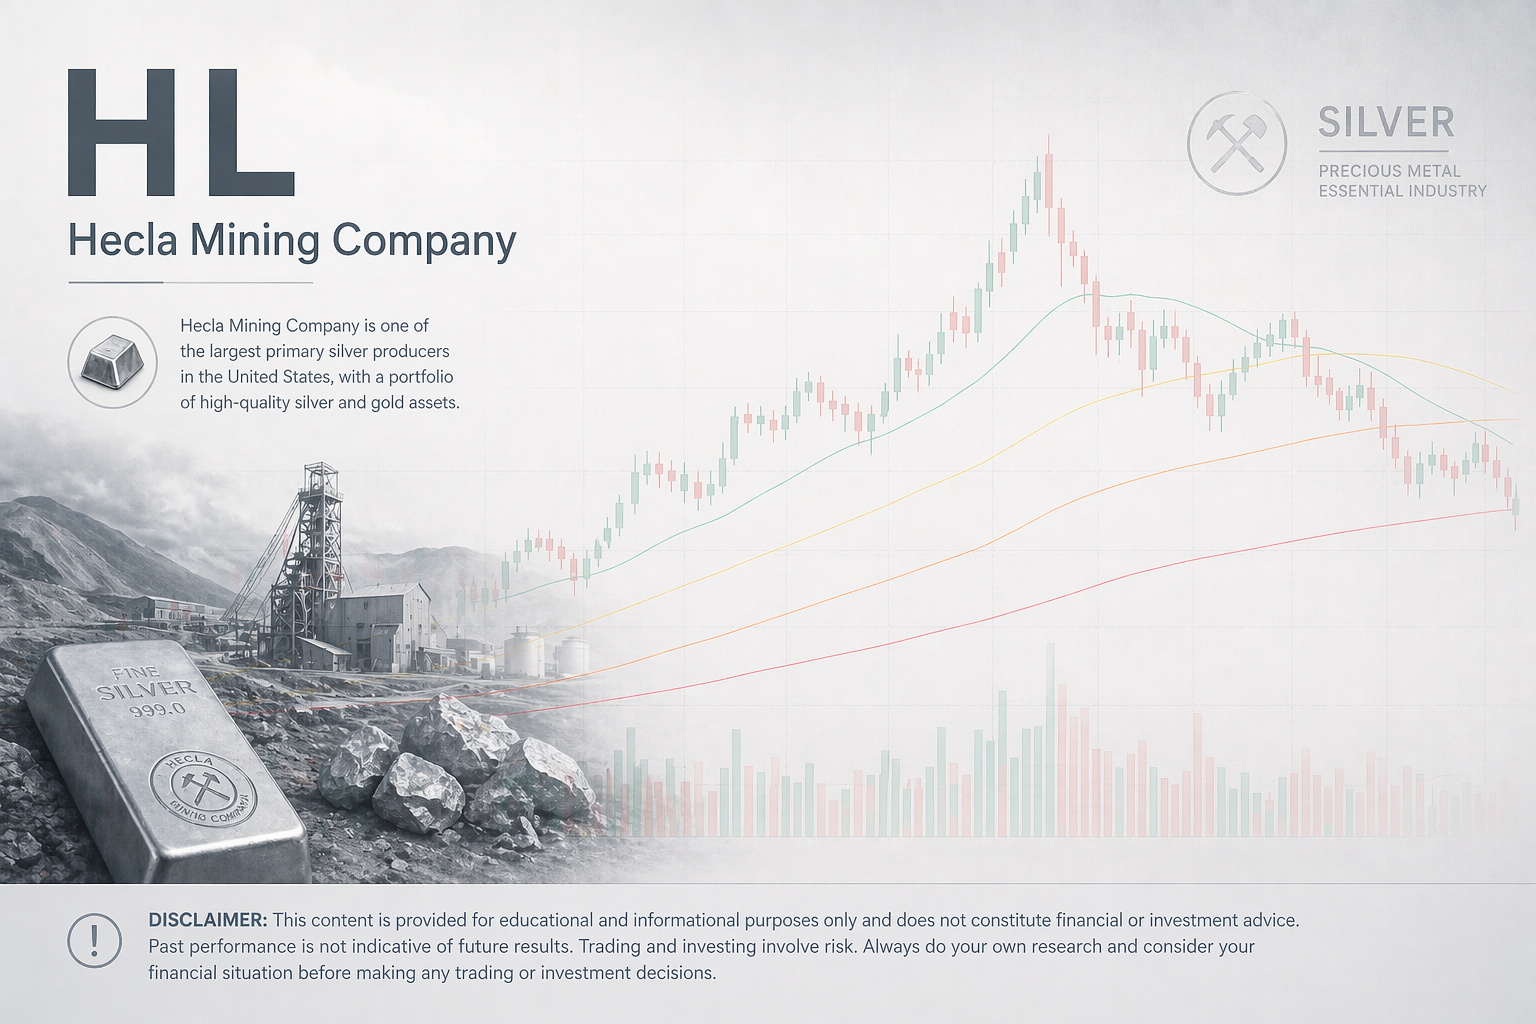
In this example, we are looking at Hecla Mining Company (HL) to illustrate how bearish flag patterns can appear and repeat within a broader price structure.
Educational Observations
- Recurring Pattern Behaviour:
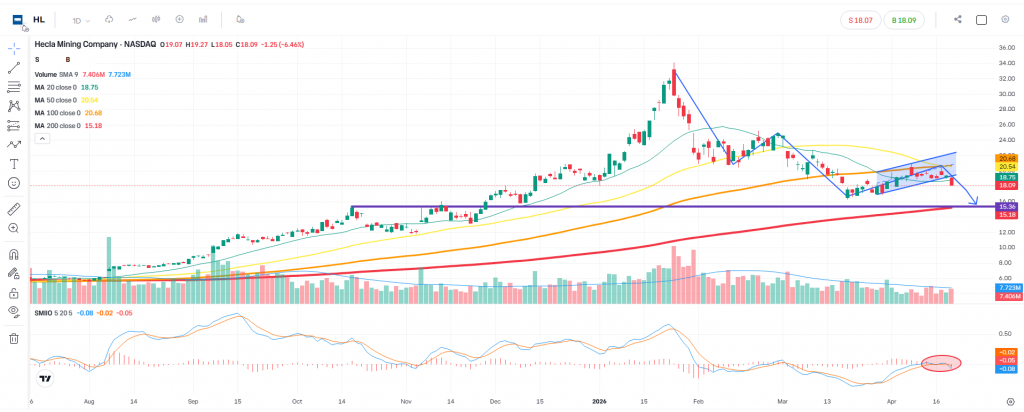
The chart shows several instances where price forms a short-term upward channel following a decline. In technical analysis, this type of structure is commonly referred to as a bearish flag, which is often studied as part of continuation pattern theory. - Current Structure:
A similar short-term upward channel has recently developed. Price has started to move away from this channel, which makes it a useful example when observing how such structures behave over time. - Candle Behaviour Context:
Some market participants may choose to observe how daily candles close relative to:- The channel boundaries
- Previous daily candles (e.g. 21/04/2026)
- Historical Reference Area:
The 15.50 region, which is close to the 200-day moving average, has previously acted as an area of interest on the chart. Levels like this are commonly reviewed when analysing historical price behaviour.
Key Takeaway
This chart serves as an example of how temporary upward movements can occur within a broader corrective phase, and how patterns such as bearish flags are interpreted in technical analysis.
It also highlights that price structures can evolve in different ways, and patterns do not always behave consistently.
Risk Awareness
When studying chart patterns, it is important to recognise that:
- Technical structures are not guaranteed to repeat
- Market conditions can change quickly
- Outcomes can vary even when similar patterns appear
For this reason, risk management and position sizing are essential considerations when applying any form of technical analysis.
Disclaimer
This content is provided for educational and informational purposes only and does not constitute financial or investment advice. The material reflects a general interpretation of technical analysis concepts using historical market data. It should not be relied upon for making trading or investment decisions. Past performance is not a reliable indicator of future results.
Leave a Reply