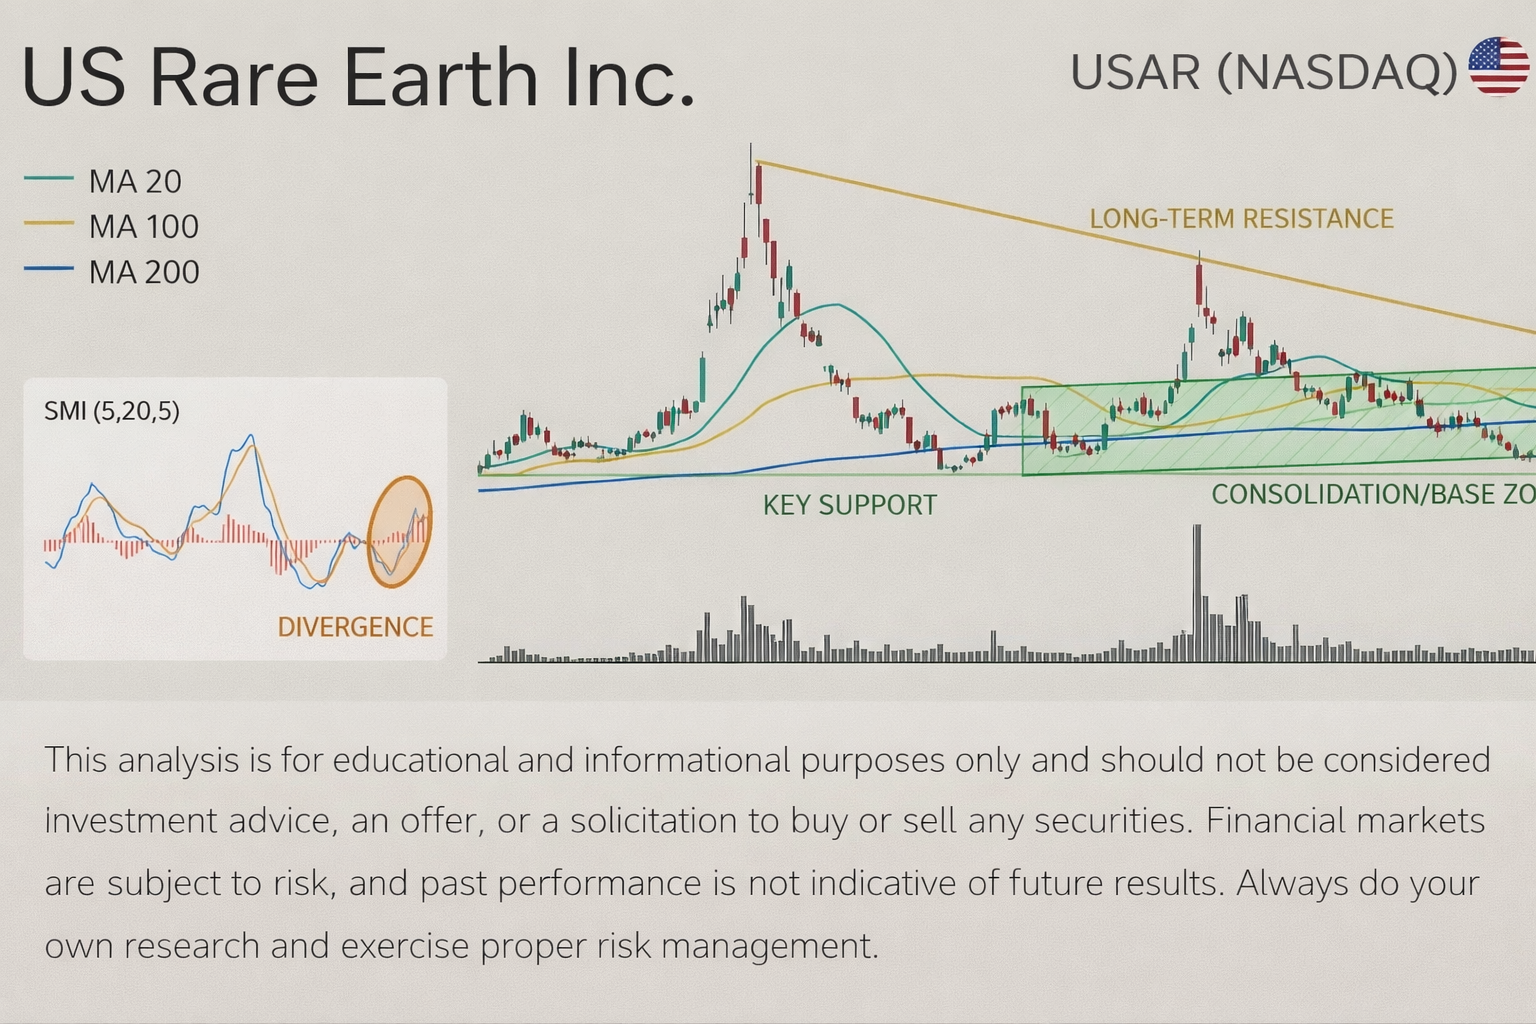
From a technical perspective, USAR is currently showing signs of constructive price behaviour, supported by trend alignment, momentum, and participation.
Trend & Moving Averages
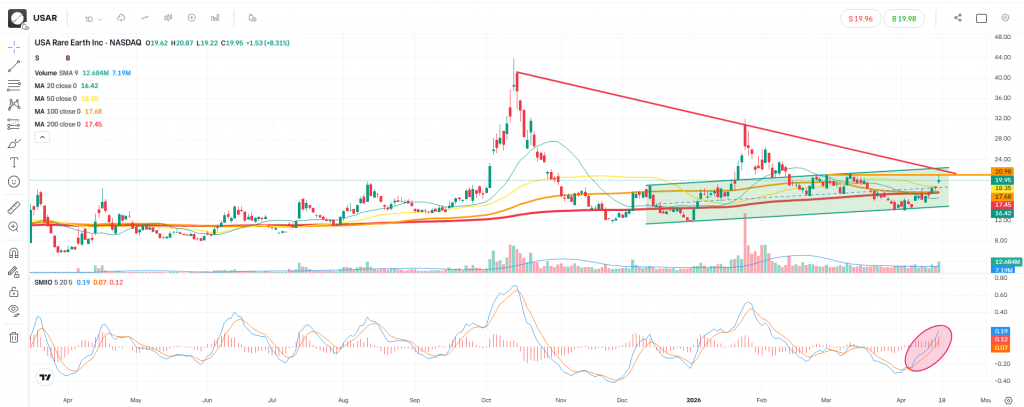
The price structure remains above key moving averages (20, 50, 100, 200), which typically indicates that the broader trend is still intact. When price sustains above these levels, it often reflects underlying strength and continued market interest.
Momentum
The SMIIO indicator is turning upwards, suggesting improving momentum. This shift can sometimes precede further upside continuation, especially when aligned with price holding above key support zones.
Volume Participation
Volume has recently picked up above its average, which may indicate increased market activity. Higher participation often plays an important role in validating price movements, particularly around key breakout areas.
Key Level to Monitor
A critical zone to watch is the 21.00 – 22.50 region.
- If the price is able to hold above this range for at least two consecutive daily closes,
- and those closes are higher than the previous day,
this could act as a technical confirmation that buyers are maintaining control and that the structure may continue to develop to the upside.
Potential Upside Reference
Looking at historical price behaviour, the 31.00 area stands out as a previous resistance zone.
If bullish conditions persist, this level may act as a reference point where price could react in the future.
Risk Consideration
As with any market structure, scenarios can change.
If the structure weakens and price moves significantly lower, the 14.00 region represents an area where the current bullish structure would be considered compromised from a technical standpoint.
This highlights the importance of position sizing and risk management, ensuring flexibility if market conditions shift.
Final Thoughts
At this stage, the chart reflects:
- Trend alignment (price above moving averages)
- Improving momentum
- Increased volume participation
However, confirmation around the 21.00 – 22.50 zone remains key before drawing stronger conclusions about continuation.
As always, patience and structure validation are essential when interpreting market behaviour.
Disclaimer
This analysis is provided for educational and informational purposes only. It does not constitute investment advice, financial promotion, or a recommendation to buy or sell any financial instrument. Financial markets carry risk, and you should conduct your own research and consider seeking independent advice before making any trading or investment decisions.
Leave a Reply