
From a structural perspective, the chart is currently forming a symmetrical triangle, which typically represents a period of consolidation before a potential expansion in volatility.
However, when we look deeper into the price action, we can see that the structure is leaning slightly towards the bullish side.
What supports the bullish bias?
- Double Bottom Formation
The recent price action suggests a double bottom structure, indicating that selling pressure may be weakening and buyers are gradually stepping in. - Position Above Moving Averages
Price is currently trading above key moving averages, which often acts as dynamic support and reflects improving short-term momentum. - SMI Momentum Shift
The SMI indicator is turning higher, suggesting increasing bullish momentum as we approach the apex of the triangle.
What are we waiting for?
Although the structure looks constructive, we do not anticipate the breakout.
We are waiting for confirmation.
Our confirmation criteria:
- Two consecutive daily candle closes above the descending trendline
- Each close should ideally be strong and higher than the previous day
This would indicate that buyers are in control and the breakout is valid.
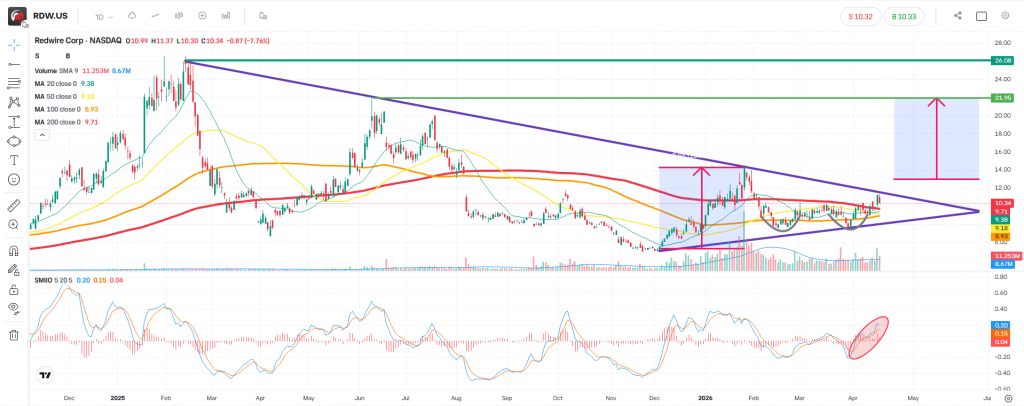
Target Projection
Once a confirmed breakout occurs:
- We measure the height of the triangle (from the lowest to highest point)
- Then project this distance from the breakout level
This gives a potential target around: 21.95
Trade Management Approach
- If the breakout develops as expected, we would monitor price action and trail the stop loss accordingly
- As the market moves in our favour, we may adjust risk dynamically rather than keeping a fixed stop
Risk Scenario
- If the structure fails and price breaks down instead:
- The invalidating level sits around 6
- A move towards this level would suggest the pattern has failed
Position Sizing Reminder
Position sizing remains one of the most critical aspects of trading.
The key objective is not to be right on every trade, but to stay in the game long enough to benefit from high-probability setups.
Final Thoughts
The market is currently compressing within a symmetrical triangle, while showing early signs of bullish pressure.
However, until we see a confirmed breakout, this remains a potential setup rather than a confirmed trend.
Disclaimer
This analysis is for educational and informational purposes only. It does not constitute investment advice or a recommendation to buy or sell any financial instrument. Always conduct your own research and ensure proper risk management before making trading decisions.
Leave a Reply