When we look at the recent price action in GSAT, the structure provides a clear example of how classical chart patterns can guide expectations — but more importantly, how we manage risk around them.
1. Descending Triangle & Breakout Confirmation
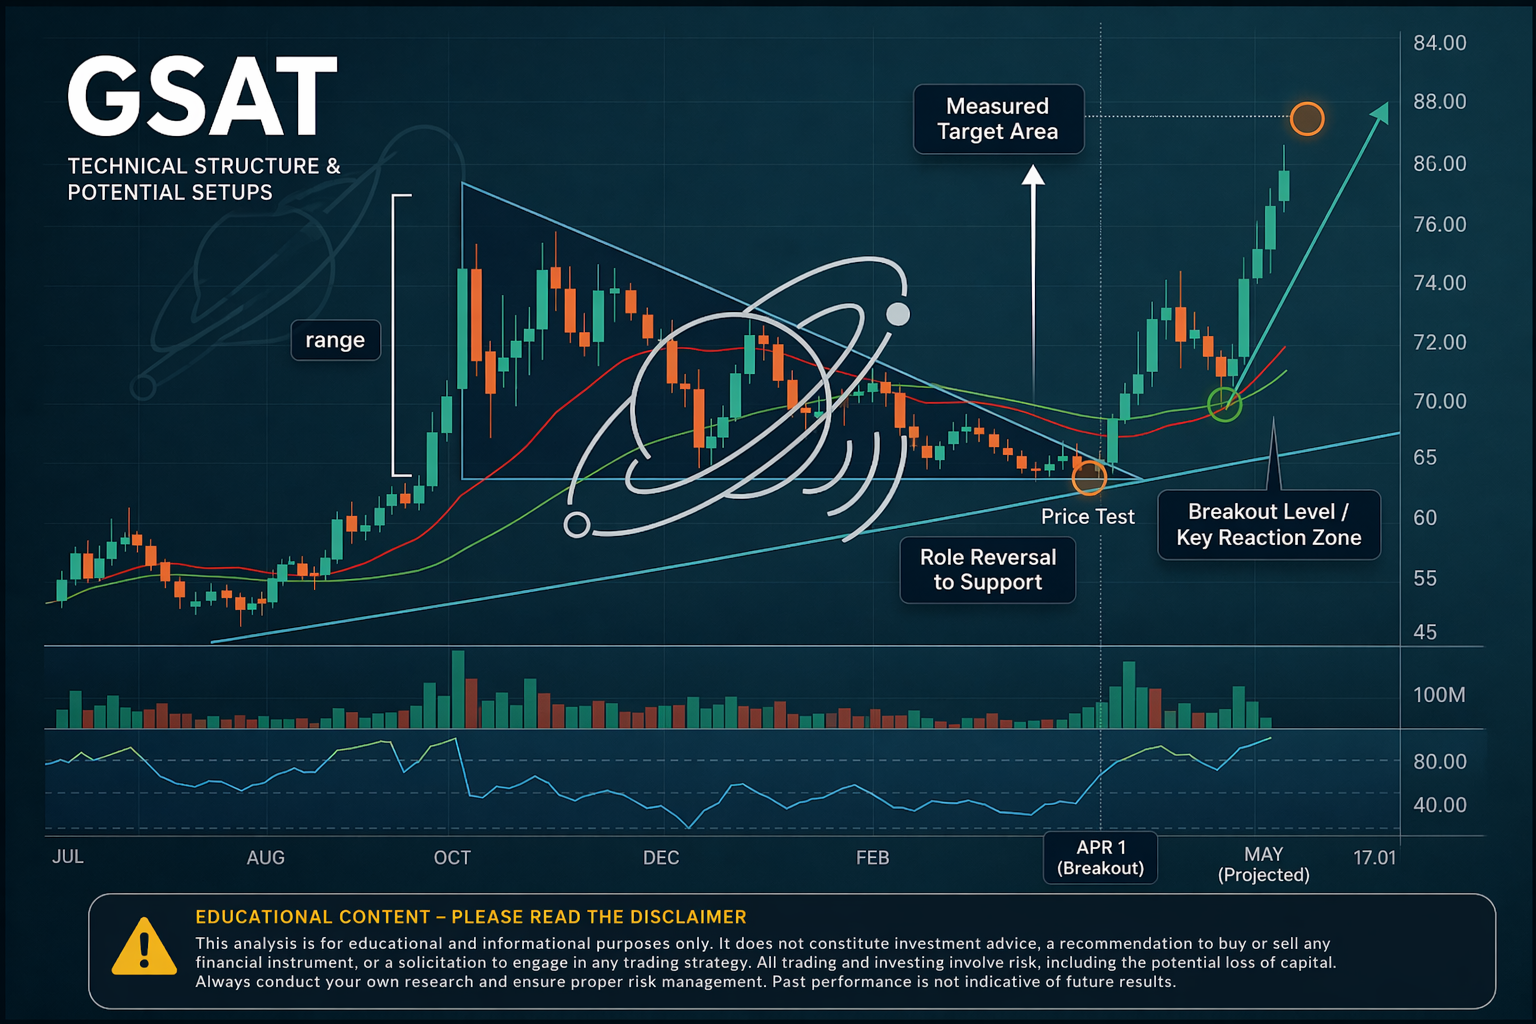
From late 2025 into early 2026, price formed a descending triangle, characterised by:
- A flat support base around $68
- Lower highs compressing price into that level
On 1st April, price broke above the structure, confirming a bullish breakout. This is an important moment structurally, as it shifts the market from compression into expansion.
2. Measured Move – How the Target is Derived
As we’ve discussed in previous educational contents, one way to estimate potential movement is by using the measured move technique.
- Distance from triangle low to top: ~$20
- Breakout level: $68
By projecting this distance from the breakout point:
- $68 + $20 = $88
This gives us a projected target area around $88.
The key idea here is not prediction, but framework — it helps us understand how far a move can extend if momentum continues.
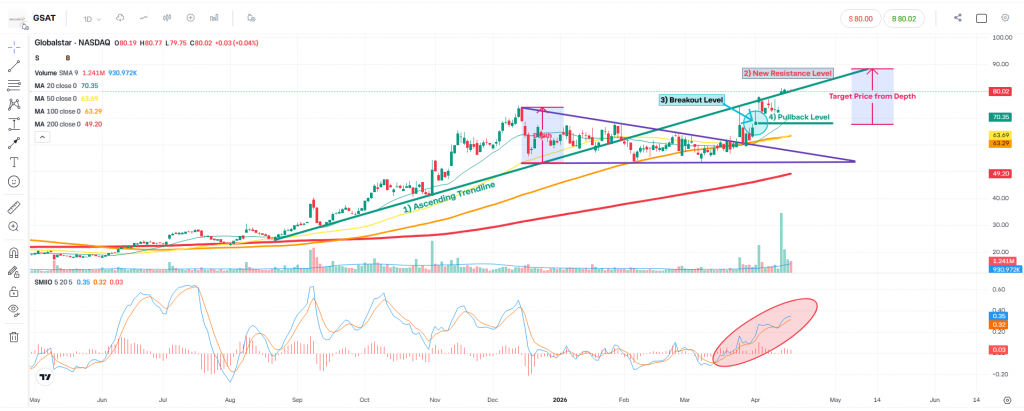
3. Ascending Trendline – Shift in Behaviour
Since August, GSAT has respected an ascending trendline, initially acting as support.
However, more recently:
- Price has moved below this trendline
- The same trendline is now acting as dynamic resistance
This type of role reversal is important — it shows a change in market behaviour, not just direction.
4. Two Educational Scenarios to Monitor
Based on the current structure, there are two key areas we are watching from an educational perspective:
Scenario 1 – Pullback into Breakout Zone
- If price retraces, the $68 region (previous breakout level) becomes structurally significant
- This area may act as a reaction zone, as prior resistance often turns into support
Scenario 2 – Completion of Measured Move
- If momentum continues, the $88 region aligns with the projected move
- This area may act as a reaction or exhaustion zone, where price could slow down or reassess
Final Thoughts
This is a strong example of how:
- Structure (triangle)
- Confirmation (breakout)
- Projection (measured move)
- Behaviour shift (trendline flip)
…all come together to form a complete technical framework.
As always, the focus is not on being right, but on understanding structure and managing risk around key levels.
Disclaimer
This analysis is for educational and informational purposes only. It does not constitute investment advice or a recommendation to buy or sell any financial instrument. Always ensure proper risk management and conduct your own research.
Leave a Reply