1) Timeframe Context
This analysis is based on the weekly chart, which allows us to focus on the broader structure rather than short-term noise.
2) Identifying the Parabolic Structure
We initially observed a parabolic move developing, which naturally raises the question:
Where could the potential top form?
To approach this:
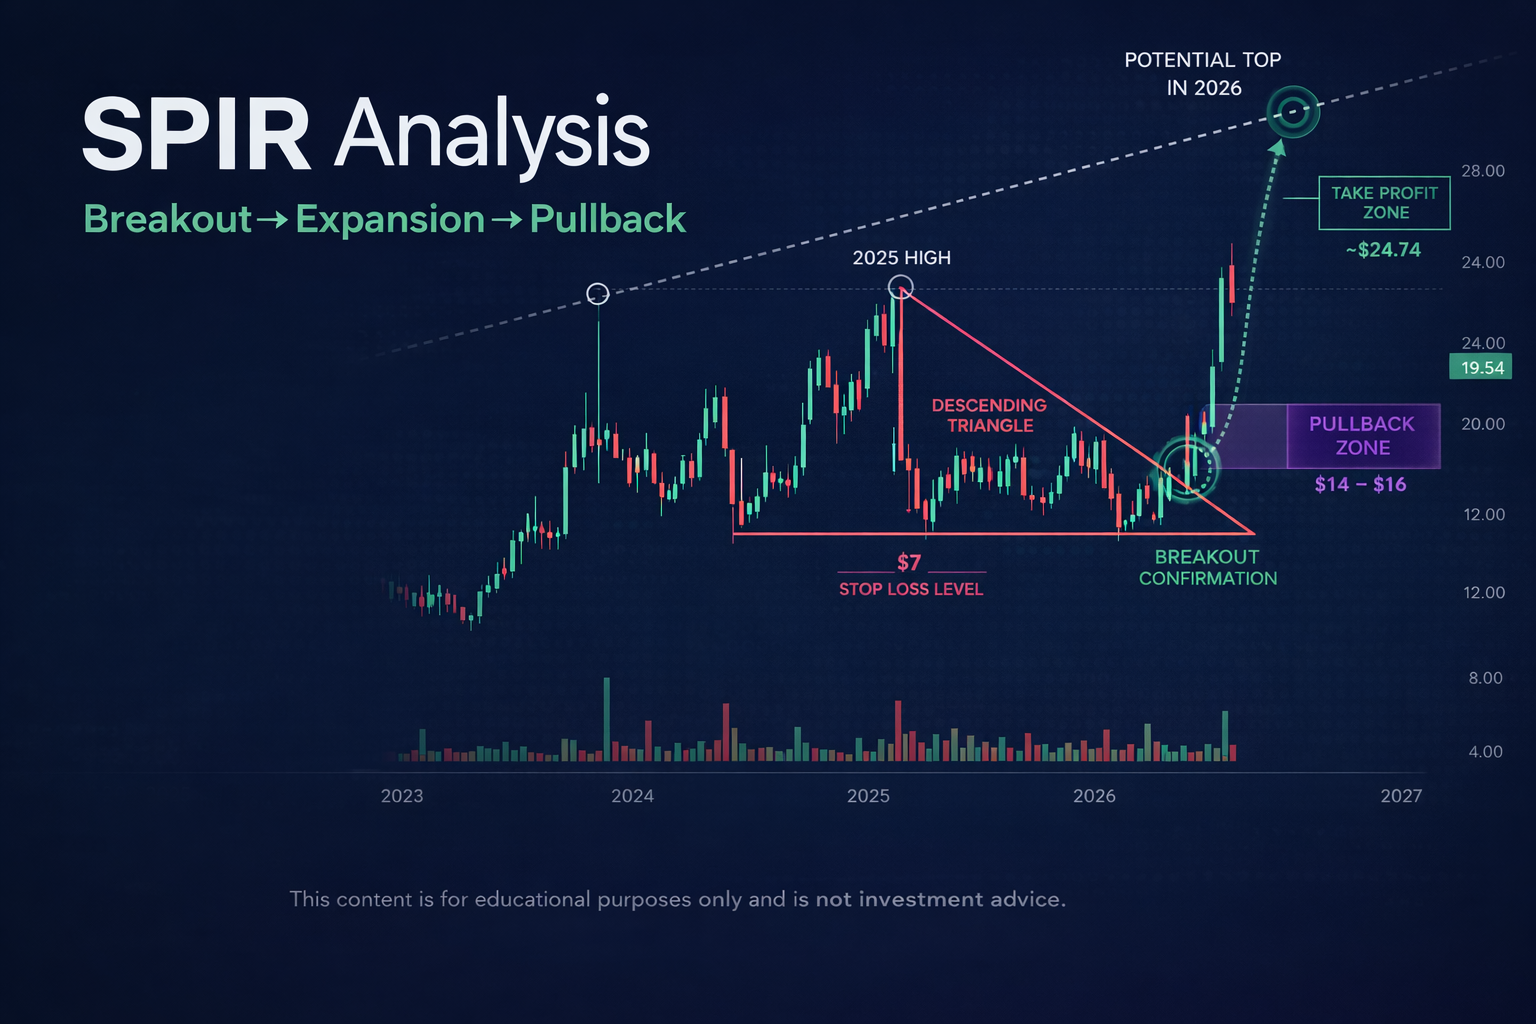
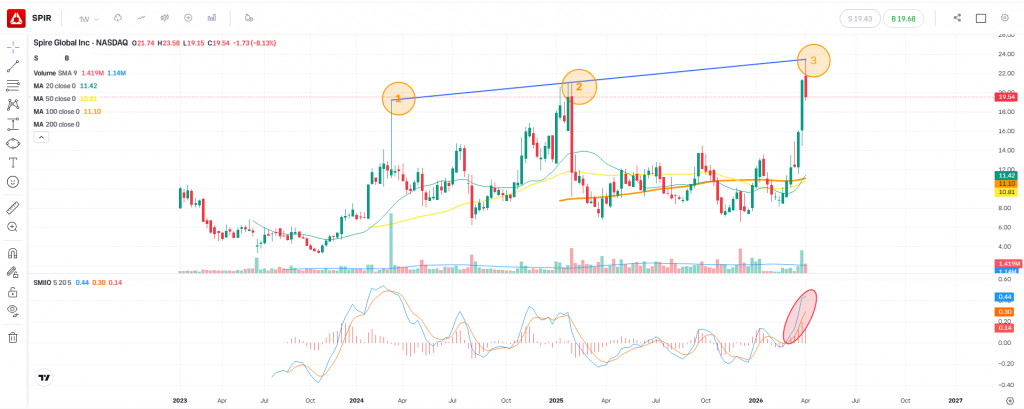
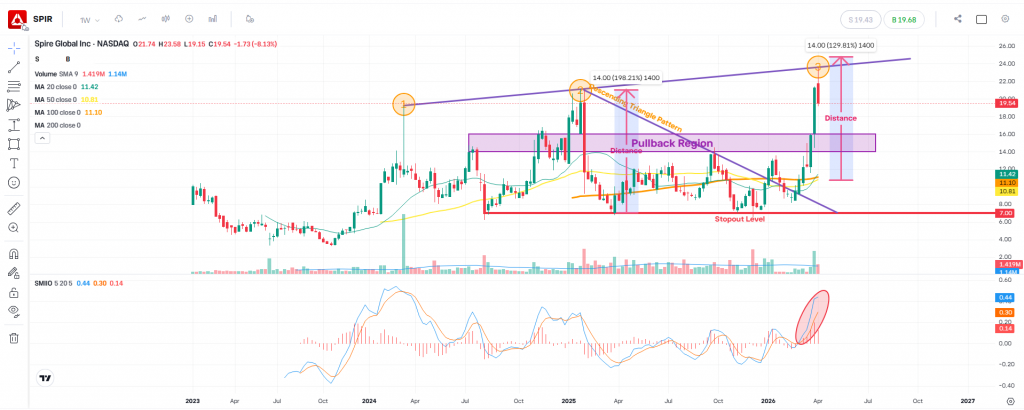
- We connected the major highs from 2024 and 2025
- Then extended this trendline forward into 2026
This gave us a projected upper boundary, acting as a potential exhaustion zone.
3) Descending Triangle Formation
At the same time, price was compressing into a descending triangle, defined by:
- Lower highs (downward pressure)
- A stable support base
This type of structure typically signals build-up before expansion.
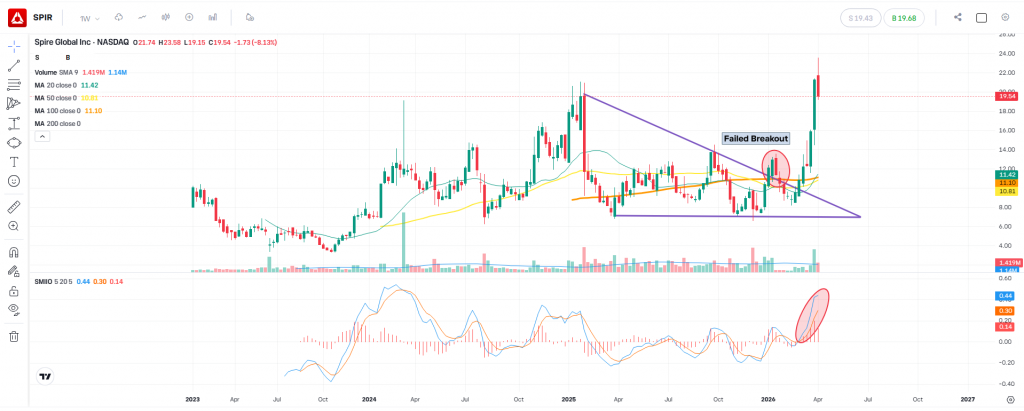
4) Breakout Behaviour – First Attempt
At the beginning of 2026:
- Price broke out of the triangle
- However, it failed to hold above the structure
This is a key behaviour we always consider:
Breakouts can fail — and often do before the real move begins.
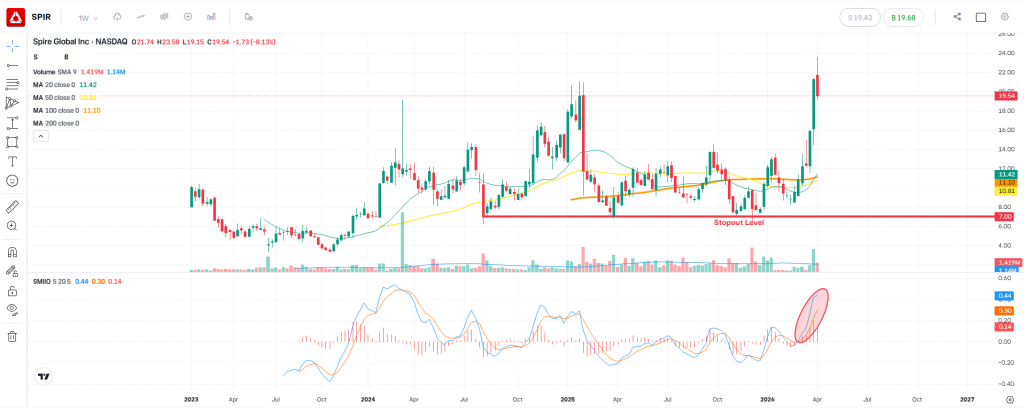
5) Risk Management: Defining the Invalidation Level
Because failed breakouts are part of the process:
- A clear stop-loss level must always be defined
- In this case, the $7 level (structure base) provided a logical invalidation point
This ensures that:
The risk is controlled, and capital is preserved for future opportunities
6) Positioning Matters
It is critical to size positions correctly, especially in volatile structures like this.
Why?
Because maintaining flexibility allows:
- Re-entry opportunities
- Participation in the real move when it develops
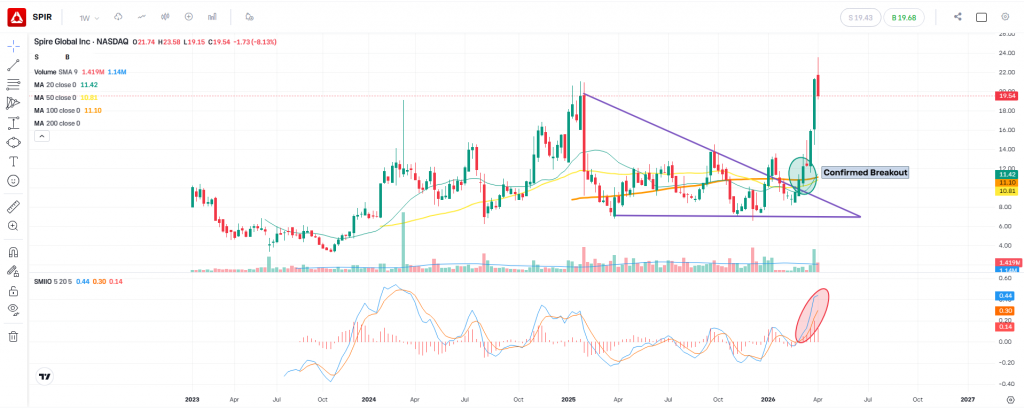
7) Breakout Confirmation – Second Attempt
In March 2026:
- Price broke out again
- This time, it held above the structure
- Momentum expanded aggressively
This marked the true breakout phase, leading into a parabolic move higher
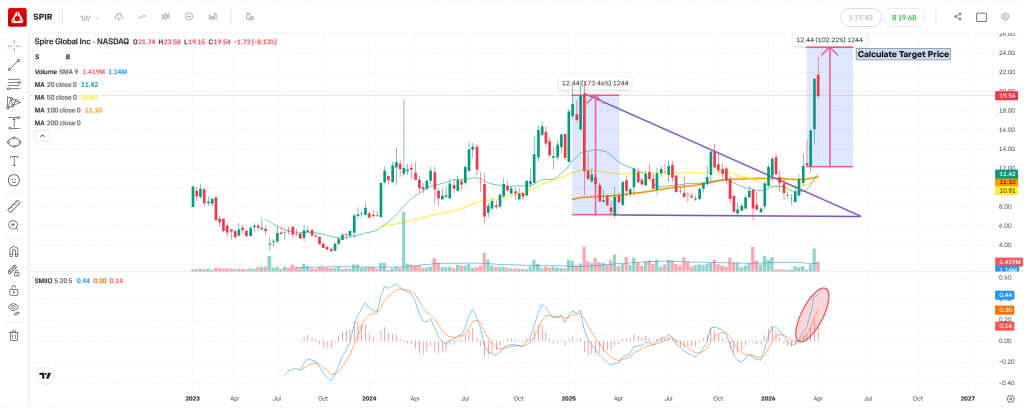
8) Measured Move Projection
To estimate the potential upside:
- Measure the distance from:
- Triangle low (~$7)
- To triangle high (~$21)
→ This gives a range of approximately $14
Applying this to the breakout:
- Projected target: ~$24.74
9) Confluence with Trendline
Interestingly:
- This projected level sits just above the extended trendline from prior highs
This creates a confluence zone, rather than a precise price.
Markets rarely reverse at exact levels — they react within regions.
10) Take Profit Approach
Because of this:
- It is more practical to treat this as a take-profit zone, not a single price
As price approaches this region:
- Risk should be reduced
- Exposure should be managed
11) Trade Management
At this stage:
- Instead of closing positions immediately
- A more effective approach is to trail the stop loss higher
This allows:
- Locking in profits
- While still participating if momentum continues
12) Current Behaviour: Pullback Phase
Price is now showing signs of:
- Rejection at higher levels
- A shift into a pullback phase
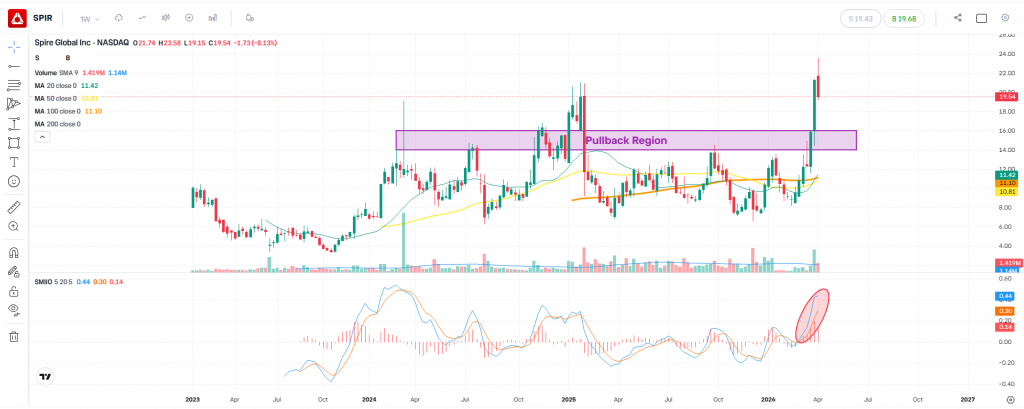
13) Potential Pullback Region
Given the broader structure:
- The market remains within a bullish channel
A healthy pullback could revisit:
👉 $14 – $16 region
This area represents:
- Prior resistance
- Potential support
- A decision zone for continuation
14) Downside Risk Reference
If the structure fails:
- The $7 level remains the key invalidation point
- As it represents the base of the entire formation
🧠 Final Thoughts
This chart is a strong example of:
- Compression → Failed breakout → Confirmed breakout → Expansion → Pullback
The key takeaway for us is:
“It’s not about predicting the move — it’s about managing risk and staying positioned for when the real move happens.”
⚠️ Disclaimer
This analysis is for educational and informational purposes only.
It does not constitute investment advice or a recommendation to buy or sell any financial instrument.
Always conduct your own research and apply proper risk management.
Leave a Reply