Market Structure Overview
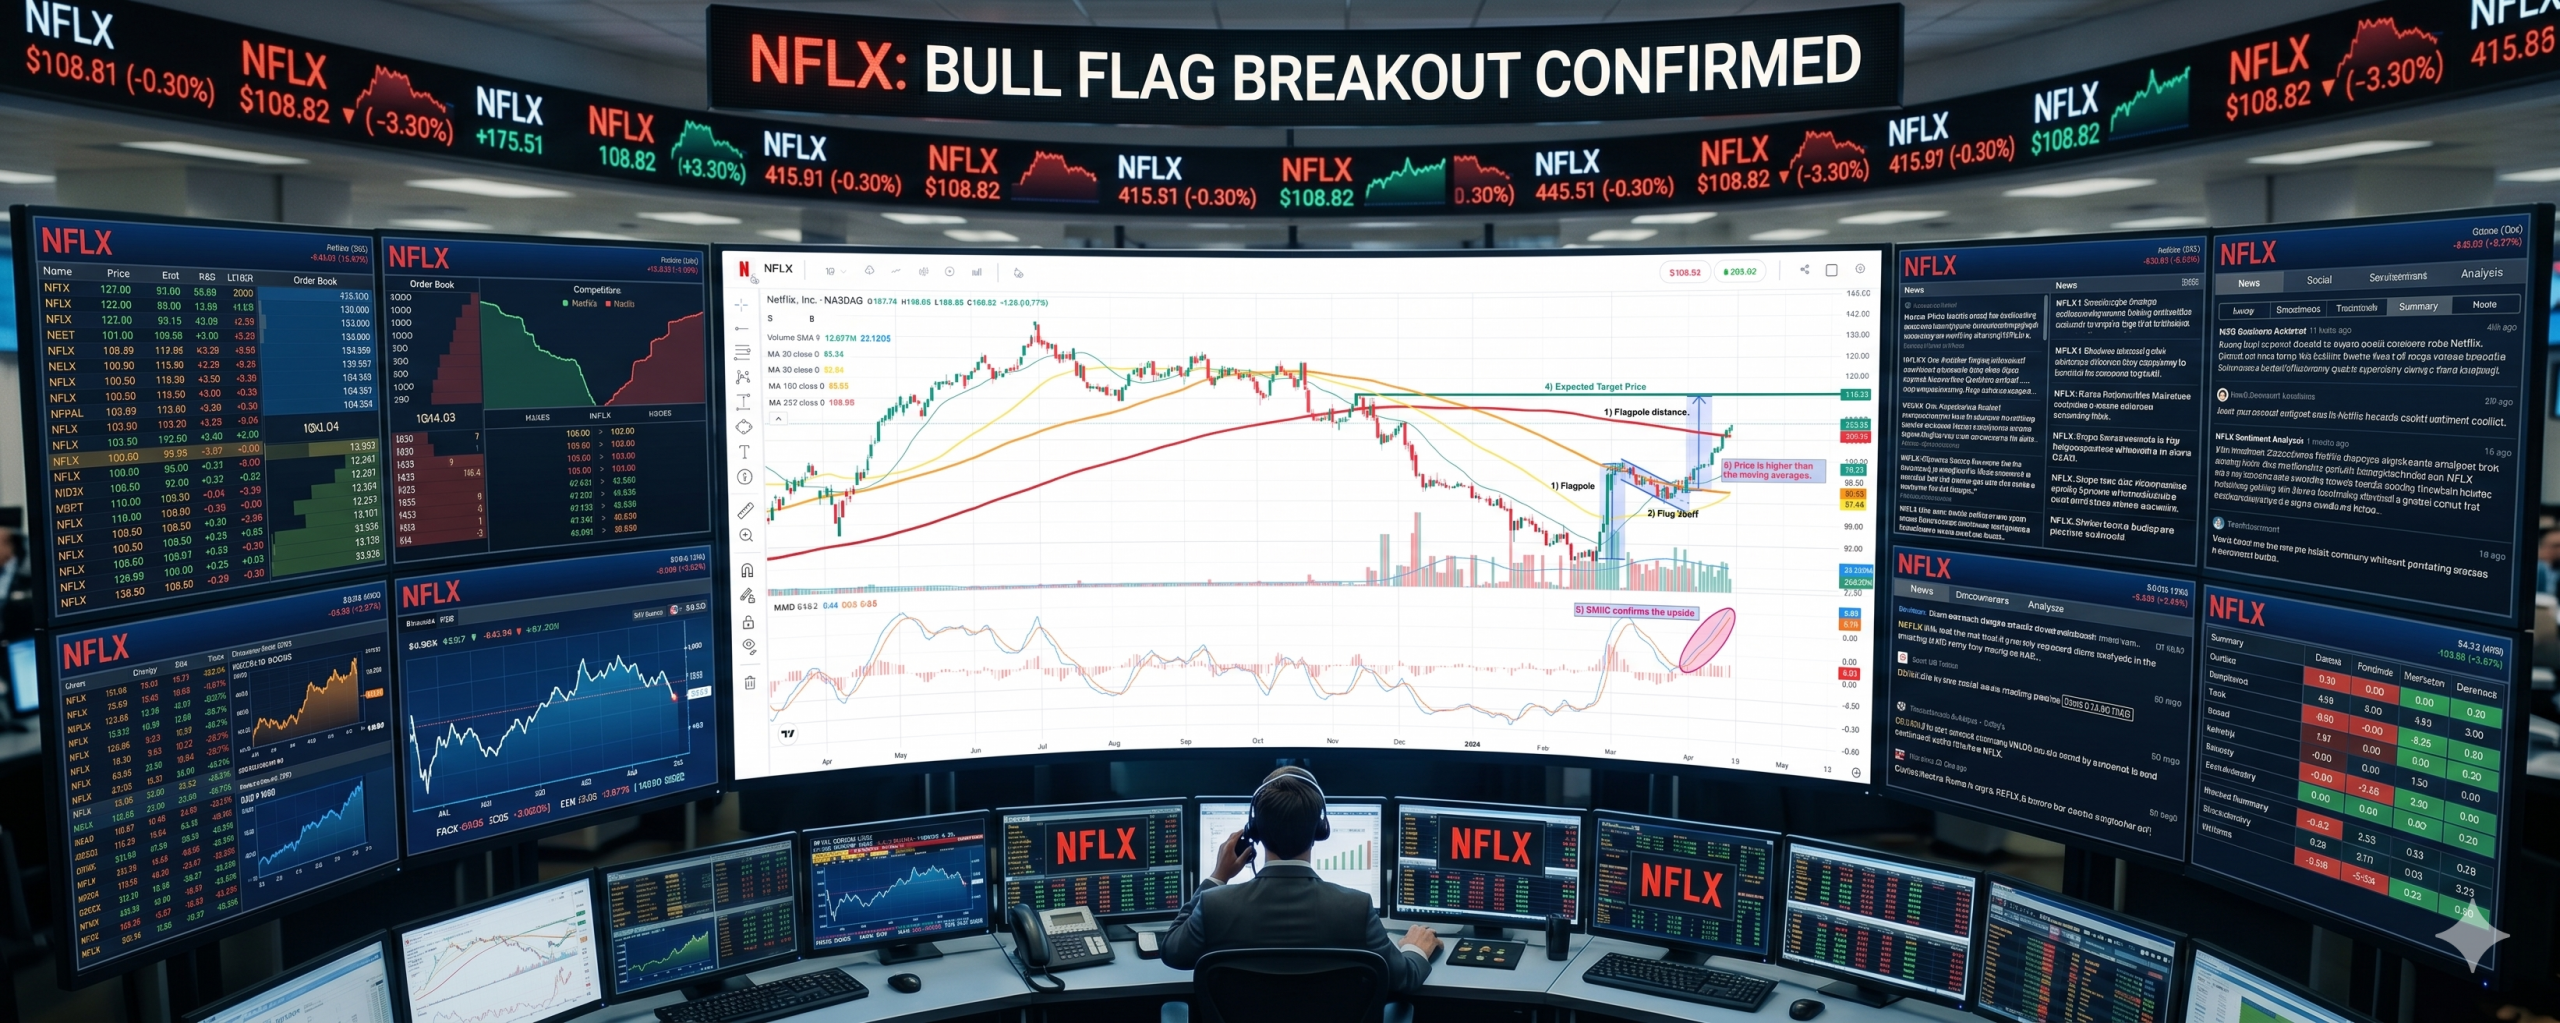
Netflix has recently shown a notable shift in structure following a prolonged downtrend. After a strong impulsive move higher, price entered a consolidation phase, forming a bullish flag pattern, which we typically interpret as a continuation structure within trending conditions.
The initial upward move (flagpole) reflects strong buying interest, while the consolidation (flag) suggests a temporary pause rather than a reversal.
Pattern Development and Breakout Context
From a technical perspective, the sequence we are observing is:
- A sharp bullish impulse, establishing momentum
- A controlled pullback, forming a downward-sloping flag
- A breakout attempt, signalling potential continuation
The measured move derived from the flag structure projects a potential upside region near 115.90, which aligns with prior price interaction zones on the chart.
That said, measured targets are not predictions — they are simply reference points based on historical price behaviour.
Moving Averages and Trend Alignment
Price is now trading above key moving averages (20, 50, and 100-day), which suggests improving short- to medium-term momentum.
However, the 200-day moving average remains slightly above current price, making it an important area to monitor. Historically, this level can act as a dynamic barrier, especially during transitional market phases.
Momentum Confirmation (SMIIO)
The SMIIO indicator is currently turning higher and showing positive momentum alignment, supporting the idea that buying pressure has increased in the short term.
This type of confirmation is important, particularly after consolidation patterns, as it helps validate whether momentum is continuing or fading.
What We Are Monitoring Next
Rather than assuming continuation, we focus on confirmation:
- Whether price can hold above the flag breakout zone
- If we see continued closes above key moving averages
- Whether momentum indicators remain supportive rather than diverging
- How price behaves around the 200-day moving average
If structure holds, the market may continue to explore higher levels.
If it fails, the recent breakout could turn into a false move, which is why risk management and position sizing remain key.
Final Thoughts
From our perspective, this is a developing structure rather than a completed move.
The combination of:
- A confirmed flag breakout attempt
- Improving momentum
- Price reclaiming key moving averages
suggests a shift in behaviour — but not yet a fully confirmed trend reversal.
As always, we prefer to let the market confirm direction rather than anticipate it.
Disclaimer
This content is for educational and informational purposes only and does not constitute investment advice. Markets involve risk, and all trading decisions should be made based on your own analysis and risk management.
Leave a Reply