Market Structure Overview
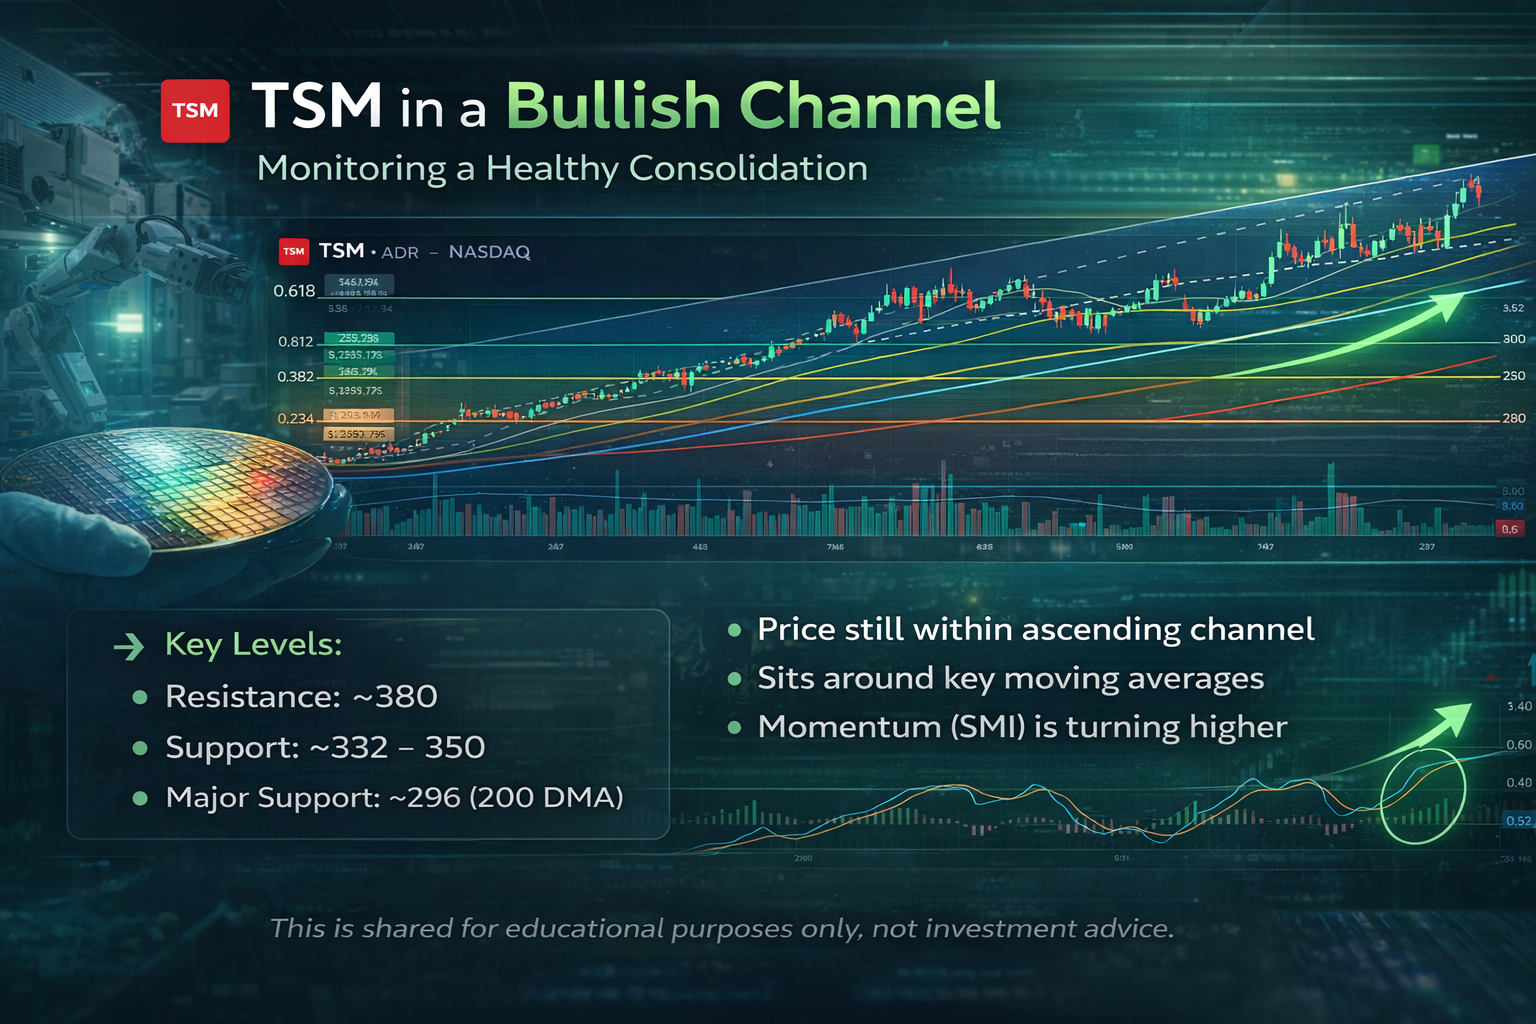
From a structural perspective, TSM remains within a well-defined bullish channel, with price continuing to respect both the upper and lower boundaries over the medium to long term.
After the strong rally into early 2026, price has entered a consolidation phase, but importantly:
- The broader uptrend structure has not been broken
- Higher lows are still being maintained within the channel
- The recent pullback appears corrective rather than a full trend reversal
This keeps the overall bias in a monitoring phase within an uptrend, rather than a bearish shift.
Key Technical Observations
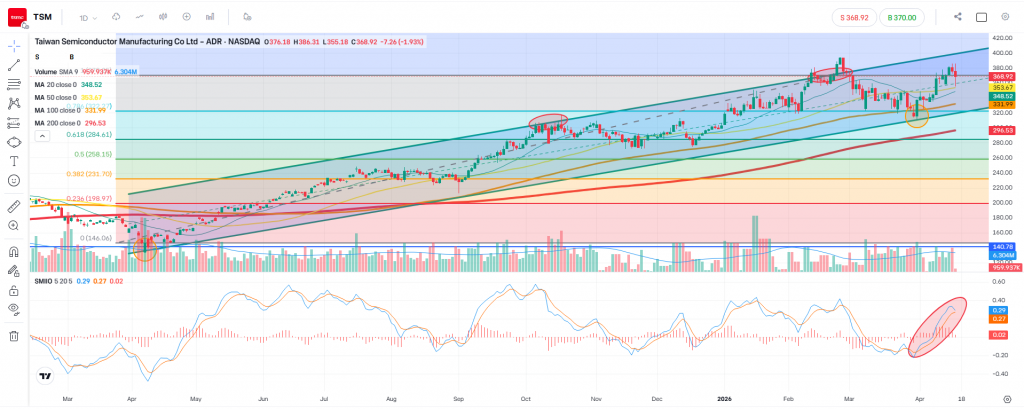
1) Channel Structure Intact
- Price recently reacted from the upper boundary of the ascending channel
- The pullback held above key dynamic supports, suggesting controlled profit-taking rather than aggressive selling
2) Moving Averages Alignment
- Price is currently trading:
- Around the 20-day and 50-day moving averages
- Above the 100-day and 200-day moving averages
- This type of alignment typically reflects a healthy trend with short-term consolidation
3) Fibonacci Support Zone
- The pullback has respected the 0.618 retracement area (~$284) previously
- Current price action is holding above mid-range Fibonacci levels, keeping the structure constructive
4) Momentum (SMIIO) Turning Higher
- The SMI indicator is showing a clear upward turn from oversold levels
- This suggests momentum is rebuilding, rather than deteriorating
Key Levels We Are Monitoring
- Resistance Zone: ~$380
- Recent rejection area near channel highs
- A break above this level would indicate continuation strength
- Intermediate Support: ~$332 – $350
- Confluence of moving averages and prior structure
- Key area for maintaining bullish structure
- Major Support: ~$296 (200-day MA)
- A critical level for trend integrity
- A break below this would shift the structure to neutral
What Would Change the Structure?
From our perspective, the structure remains constructive as long as the channel holds.
We would reassess the trend if:
- Price breaks and sustains below the 200-day moving average
- The bullish channel is clearly invalidated
- Momentum indicators fail to recover and roll over again
On the upside, a confirmed move:
- Above $380
- With improving momentum and volume
…would suggest trend continuation toward higher levels.
Final Thoughts
TSM continues to reflect a strong long-term trend supported by structure, while short-term price action shows consolidation near key levels.
At this stage, we are not anticipating a reversal, but rather:
- Observing whether momentum aligns with structure
- And whether price can reclaim higher levels within the channel
This remains a technical monitoring phase, where confirmation matters more than anticipation.
Disclaimer
This content is provided for educational and informational purposes only and does not constitute investment advice. We do not provide personalised recommendations. Always ensure your trading decisions are supported by your own research and risk management.
Leave a Reply