This is an educational piece where we share our approach to reading and interpreting price action, using Cenovus Energy Inc (CVE) as a current example.
We focus purely on structure, momentum, and intermarket relationships rather than company fundamentals.
What We Are Observing
There are a few key developments on the chart that are worth highlighting from a price action perspective:
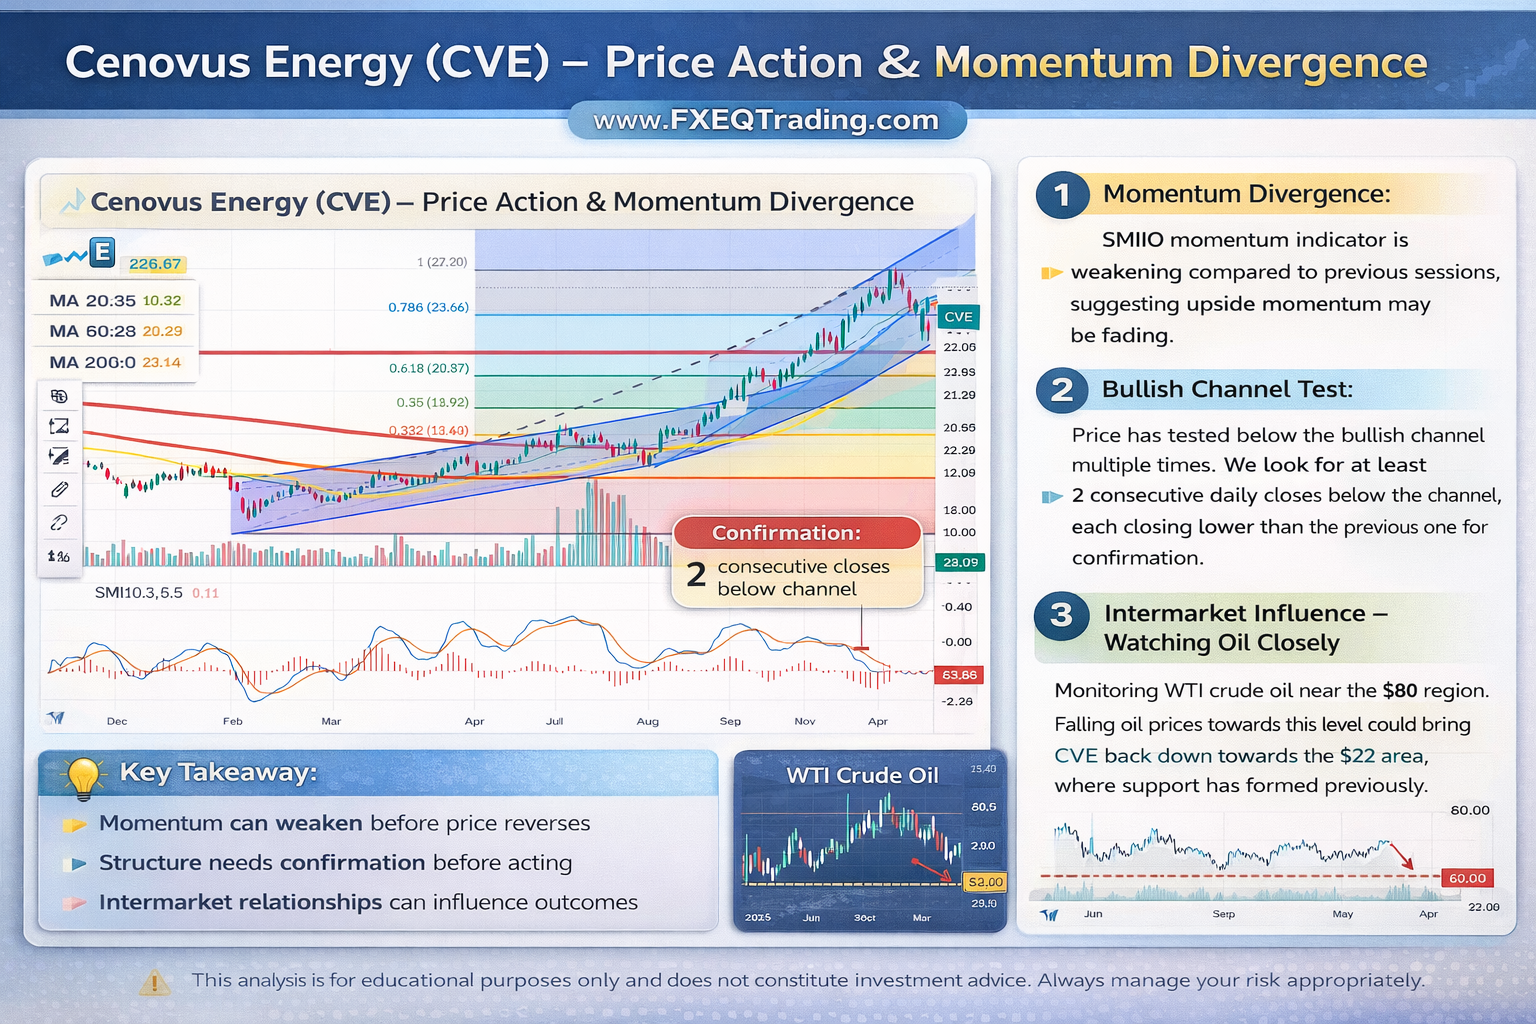
1) Momentum Is Starting to Fade
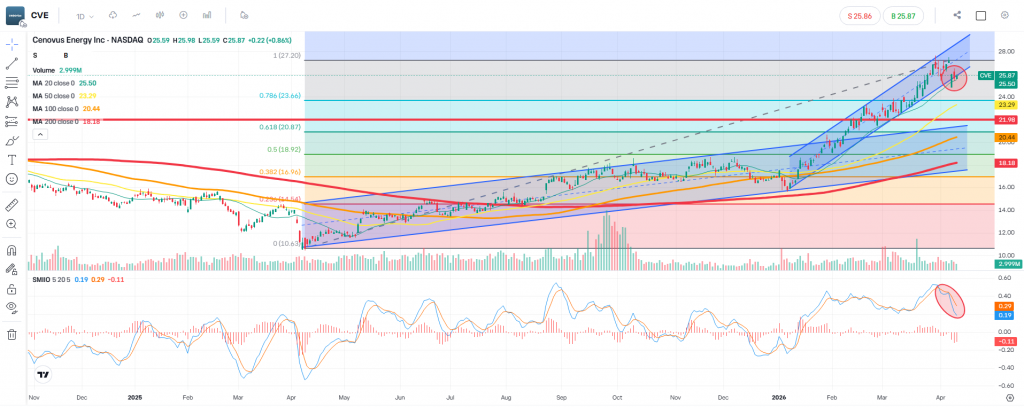
The SMIIO momentum indicator is beginning to weaken compared to previous sessions.
While price has been trending higher, the loss of momentum suggests that buyers may be losing strength.
This type of divergence between price and momentum is often an early signal that the trend could slow down or enter a corrective phase.
2) Bullish Channel Under Pressure
Price has tested below the bullish channel multiple times over the past few days.
From a structural perspective, this is important.
However, we do not act on a single break. Instead, we look for confirmation:
- At least 2 consecutive daily closes below the channel
- Each candle closing lower than the previous one
This type of behaviour would indicate that the bullish structure is weakening and that sellers are beginning to take control.
3) Intermarket Influence – Watching Oil Closely
As an energy stock, CVE is naturally influenced by oil prices.
We are currently monitoring WTI Crude Oil closely.
If WTI moves back towards the $80 region, it could:
- Shift sentiment in the energy sector
- Influence CVE’s structure
- Potentially drive price back towards the $22 area, where previous reactions have occurred
This highlights the importance of not analysing assets in isolation, but rather within their broader market context.
Our Approach
At this stage, this is simply a structure-based observation.
We are not predicting direction.
Instead, we are:
- Monitoring confirmation signals
- Waiting for clearer price action
- Letting the market show its intent before acting
When momentum and structure begin to diverge, patience becomes even more important.
Key Takeaway
This chart is a good example of how:
- Momentum can weaken before price reverses
- Structure needs confirmation before acting
- Intermarket relationships can influence outcomes
As always, our focus remains on execution, discipline, and risk management, rather than prediction.
Disclaimer
This content is provided for educational and informational purposes only and does not constitute investment advice or a recommendation to buy or sell any financial instrument. Markets involve risk, and past performance is not indicative of future results. Always ensure you manage your risk and position sizing appropriately.
Leave a Reply