

Recent price developments across foreign exchange markets highlight notable volatility in the Japanese Yen, driven by suspected official intervention. This dynamic explains the sharp Yen appreciation observed over recent sessions.
Sound market analysis requires examining both chart formations and macroeconomic fundamentals concurrently. Political priorities and fiscal directives from Tokyo continue to restrict the policy scope of the Bank of Japan, leaving global markets to determine real equilibrium values.
While technical setups may suggest short term Yen strength, historical precedent tells a distinct story. Past official statements and market interventions by Japanese and American monetary authorities have frequently provided only temporary relief, with the wider currency trend ultimately prevailing.
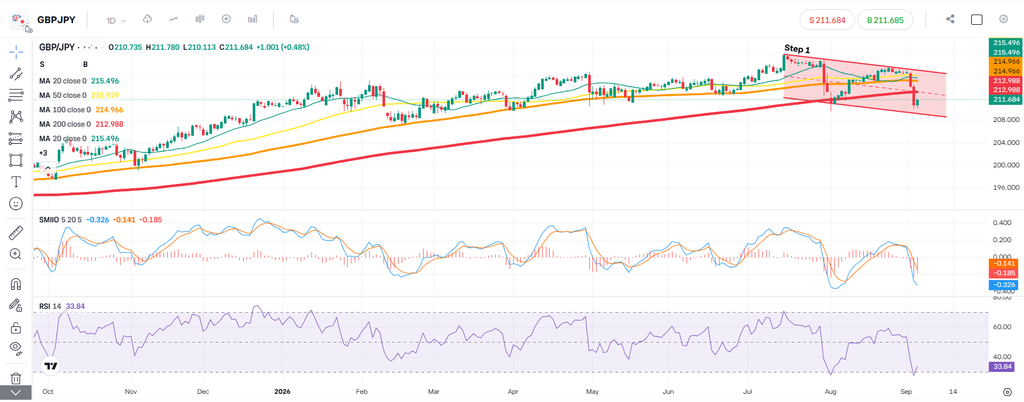
Step 1: Structural Chart Geometry
The suspected intervention on 2 September 2026 initiated a sharp corrective phase.
On the daily chart, GBP/JPY trades within a clearly defined descending channel. Connecting the sequential peaks highlights lower swing highs along the upper boundary, whilst linking the corresponding troughs maps lower swing lows along the channel floor.
Momentum indicators align with this short term pressure:
- Momentum Oscillators: Both the Relative Strength Index (RSI) and the SMI Ergodic Oscillator (SMIIO) register negative momentum, reflecting active downside pressure.
- Moving Average Dynamic: Price has slipped beneath the 200 day moving average. A consecutive daily close below this benchmark often suggests a broader structural transition from bullish expansion to sustained distribution.
While technical indicators currently point towards downside continuation, long term macroeconomic realities often tell a contrasting story. Rigorous analysis requires complete objectivity: the technical structure governs current positioning, yet any structural invalidation demands an immediate reassessment of the trade thesis.
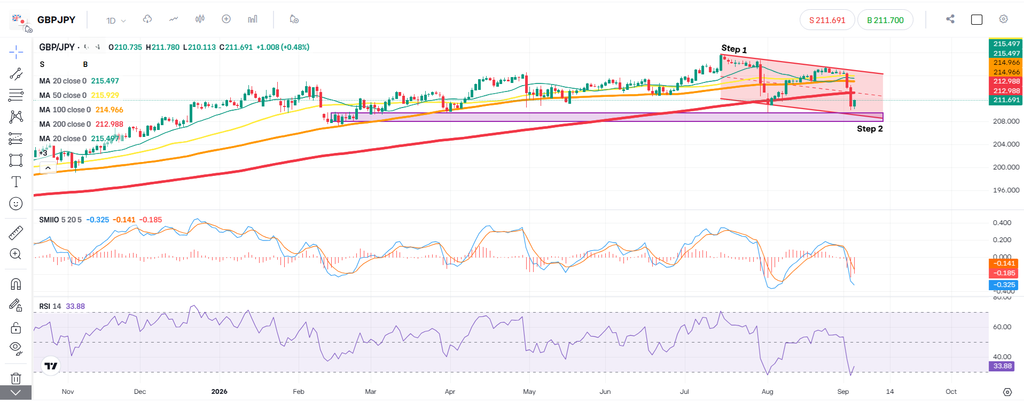
Step 2: Historical Demand Zones and Confluence Mapping
Should the descending channel trajectory persist, technical focus shifts towards locating structural price floors where institutional demand previously emerged.
The primary area of interest spans the 208.00 to 209.00 support shelf, highlighted by the horizontal demand band established in February 2026:
- Historical Price Memory: Price consolidated within this band during early February 2026 before initiating a multi month bullish expansion. Former accumulation zones frequently serve as pivotal liquidity pools during secondary tests.
- Channel Base Confluence: The lower boundary of the descending channel converges near this horizontal zone. When channel support aligns with prior multi week consolidations, the probability of structural price absorption increases significantly.
- Dynamic Support Interaction: Although price trades beneath the 200 day moving average, extended moves towards this lower band approach deeply oversold oscillator readings, raising the likelihood of mean reversion attempts.
The thesis does not assume an automatic reversal. Rather, this zone represents a critical observation benchmark where price behaviour will indicate whether buyers step in to defend structural value, or whether sustained acceptance below 208.00 confirms a broader breakdown.
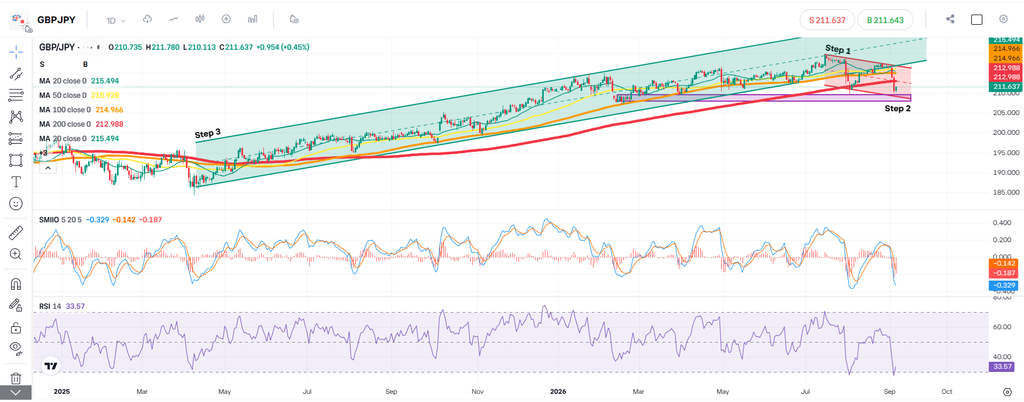
Step 3: Identification and Breakdown of the Major Ascending Channel
To contextualise current price behaviour within the macro environment, the analysis expands to the primary trend structure that governed GBP/JPY over the preceding eighteen months.
Identifying the Major Bullish Channel
A valid ascending channel requires systematic alignment across both boundaries:
- Ascending Support Baseline: The lower trendline is constructed by anchoring the major cyclical swing low established in spring 2025 and connecting the higher swing lows recorded across late 2025 and early 2026. This rising boundary reflects sustained institutional bid interest during pullbacks.
- Ascending Resistance Parallel: Projecting an equidistant parallel line across the prominent swing highs forms the upper boundary. The repeated touches and rejections along this upper boundary confirm the geometric symmetry of the channel.
- Structural Sequence: Throughout this phase, price consistently respected the sequence of higher highs and higher lows, validating persistent structural expansion.
Channel Breach and Downside Implications
The latest price action demonstrates a decisive violation of this primary trend. Price has fallen beneath the lower boundary of the major ascending channel, representing a notable structural shift:
- Loss of Dynamic Trendline Support: A clear daily penetration below the ascending base indicates that demand is no longer absorbing selling volume at previously established trendline levels.
- Secondary Momentum Confirmation: In conjunction with the breakdown beneath the descending channel in Step 1 and the loss of the 200 day moving average, this macro trendline failure provides further technical evidence of distribution towards lower price levels.
- Downside Target Confluence: As identified in Step 2, the horizontal area of interest situated between 208.00 and 209.00 serves as the primary structural level where market participants will observe whether historical demand can absorb this extended downside pressure.
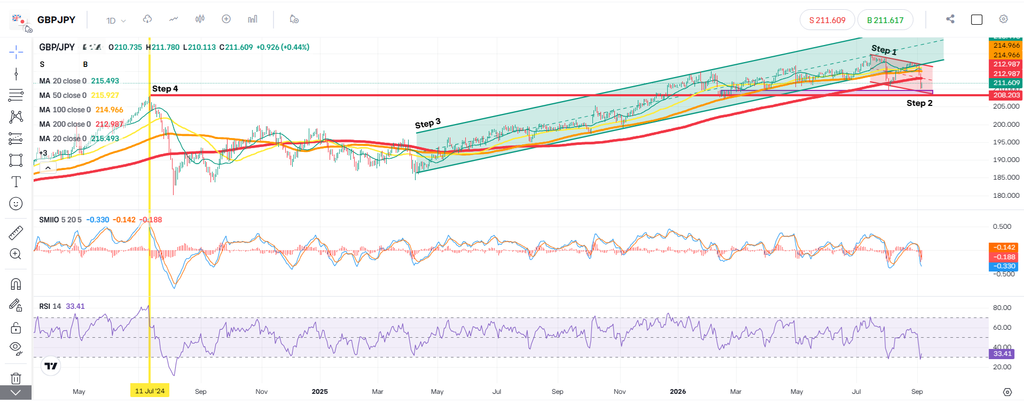
Step 4: Macro Price Memory and Trade Structure Planning
Expanding the observation window beyond the Step 3 channel reveals a major structural peak recorded on 11 July 2024.
This historic high directly converges with the horizontal area of interest outlined in Step 2 between 208.00 and 209.00. In technical market theory, previous major swing extremes that prompted protracted distribution cycles frequently transform into formidable support floors when retested from above. If selling pressure continues to push price lower, this confluence zone represents the precise structural shelf where institutional bid liquidity can emerge to absorb supply.
Synthesis of Technical Signals
The current technical backdrop confirms localised downside momentum across multiple layers:
- The short duration descending channel identified in Step 1 remains in control.
- Daily price trades beneath the 200 day moving average.
- Momentum indicators, specifically RSI and SMIIO, register persistent bearish trajectory.
- Price has broken below the multi month ascending channel mapped in Step 3.
Fundamental Divergence and Strategic Planning
While isolated technical indicators signal downside continuation, macroeconomic dynamics present a contrasting picture. Over the past year, market participants systematically absorbed official interventions, realigning currency valuations with underlying sovereign yield differentials. Pricing across the Japanese government bond market reflects these persistent pressures.
From a theoretical planning perspective, traders often look past transient intervention spikes to align with macro fundamentals, using structural technical floors to conceptualise long exposure rather than chasing momentum.
When evaluating a prospective rebound structure around the 208.00 to 209.00 floor, institutional execution requires disciplined trade design:
- Position Sizing and Capital Preservation: Entering near high volatility intervention inflection points introduces substantial downside tail risk. Robust exposure limits and mathematical capital allocation take precedence before committing capital. You can study complete theoretical sizing models in the Strategic Position Sizing and Portfolio Scaling Framework.
- Structural Target Mapping: In the event that buyers validate the 208.00 to 209.00 shelf and absorb supply, technical structure defines the primary upside objective near 216.00, marking the origin point of the latest intervention sell off.
Disclaimer: This post is for educational and informational purposes only and should not be considered as financial or investment advice. Trading financial markets involves a high level of risk, and you should always conduct your own research or consult with a professional advisor before making any investment decisions. Past performance is not indicative of future results.
Leave a Reply